

The following publication has been lightly reedited for spelling, grammar, and style to provide better searchability and an improved reading experience. No substantive changes impacting the data, analysis, or conclusions have been made. A PDF of the originally published version is available here.
Continued sluggishness in the U.S. economy has prompted widespread interest in federal proposals aimed at “jump starting” the economy. These actions are designed to use the countercyclical tools available to government, such as tax cuts and spending hikes, to spur economic growth through fiscal policy. However, these countercyclical measures are being proposed on the heels of a record increase in state and local taxes. To what extent will the stimulative effects of federal actions be counteracted by recessionary adjustments being made by state and local governments?
This Chicago Fed Letter examines the growing importance of state and local government behavior during economic recovery and the implications for the recovery anticipated for 1992. Examination of state and local fiscal actions over the business cycle indicates that this sector may be partly responsible for the sluggish recovery in parts of the nation.
Growing responsibilities
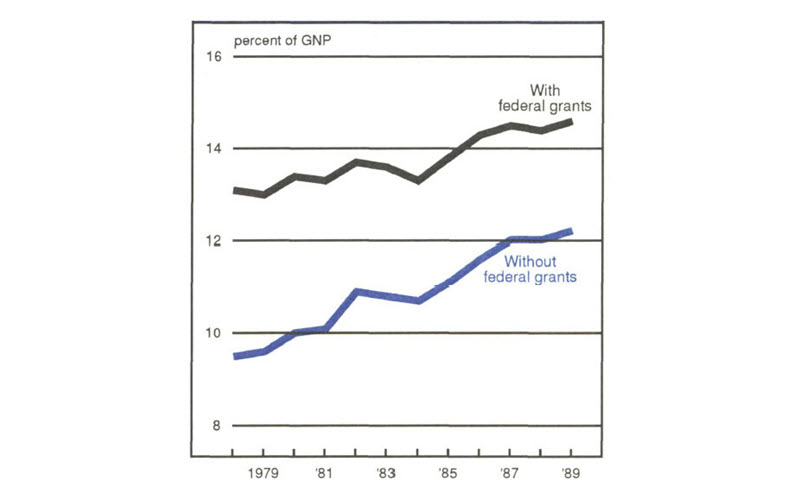
Expenditures by state and local governments grew to claim a larger share of GNP during the 1980s despite a reduction in the share of funding received from the federal government. In 1989, state and local government direct expenditures accounted for over 12% of GNP, up from 10% in 1980. When the value of federal grants designed to help support state and local government programs is added to the total, expenditures from the sector expand to 14.5% (see figure 1). This reflects the fact that both the programmatic spending and income transfer actions of state and local governments have become more significant to the economy as a whole. In particular, Medicaid and prison programs have driven state budget growth in the 1980s and into the 1990s. The upshot of the state and local sector expansion is that, when hard times hit, the timing and extent of state and local fiscal adjustment have become increasingly important.
1. State and local direct expenditures
The brakes of fiscal 1992
Heading into fiscal year 1992 (FY92), the combination of continuing recessionary revenue shortfalls and structural deficits brought state and local budget expansion to a virtual halt. The National Conference of State Legislatures reports that states passed a record $16.2 billion in discretionary tax hikes timed to take effect in FY92. This represents a national average increase of 5.4% over 1990 tax collections. These record increases were accompanied by the smallest increase in budgeted state spending since 1983, with FY92 appropriations slated to increase only .9%, after a decade in which the nominal growth in state and local expenditures was over 11% per year. The effects of this retrenchment are now being felt. Program reductions have decreased the scope of state spending, with budget reductions or restraints concentrating in such areas as economic development, public welfare, and, to some extent, education. At the same time, sales and income tax increases are reducing consumer purchasing power. The FY92 tax increase was preceded by nearly $5 billion in increased taxes in each of the two previous years.
The impact of state adjustments on budgetary stress is also filtering down to the local level. Cuts in state grants for education, revenue sharing, and other programs are leaving municipalities to their own devices but not desires. Cities, counties, and school districts must make up revenue shortfalls by either trimming spending programs or, as many local governments are planning, by hiking property taxes.
Despite these actions, the state and local sector does not appear to be out of the woods yet. Many states had budgeted on the assumption that economic recovery would have progressed far enough by now so that revenue growth would be restored. As a result of sluggish economic growth, however, even those states that had taken discretionary fiscal actions are now finding their budgets strained. For example, even though the State of Illinois extended its state income tax surcharge last year, by January the state was running $350 million behind in budgeted revenue for FY92. More generally, state legislatures are already discussing additional tax hikes to balance FY92 budgets. Meanwhile, economic growth in FY93 may not provide immediate and substantial relief.
Regional differences
Each recession has its own unique geographic pattern of hardship and, not surprisingly, state fiscal actions also reflect this pattern. In the current recession, the Northeast and the State of California have experienced the most pronounced swings in economic fortunes. The states that are the most economically distressed are also the states that have enacted the bulk of notable tax hikes. While the average change was 5.4%, the ten largest increases were significantly higher (see figure 2). The nationwide pattern of tax action is illustrated by figure 3.
2. Ten largest tax increases: 1992
| Percent of 1990 tax collections | |
|---|---|
| Pennsylvania | 24.0 |
| Connecticut | 20.2 |
| Maine | 17.0 |
| California | 14.7 |
| Vermont | 13.5 |
| Arkansas | 11.7 |
| Rhode Island | 10.6 |
| New Hampshire | 10.4 |
| Nevada | 8.8 |
| North Carolina | 7.7 |
| U.S. average | 5.4 |
3. FY92 tax changes as a percentage of 1990 tax collections
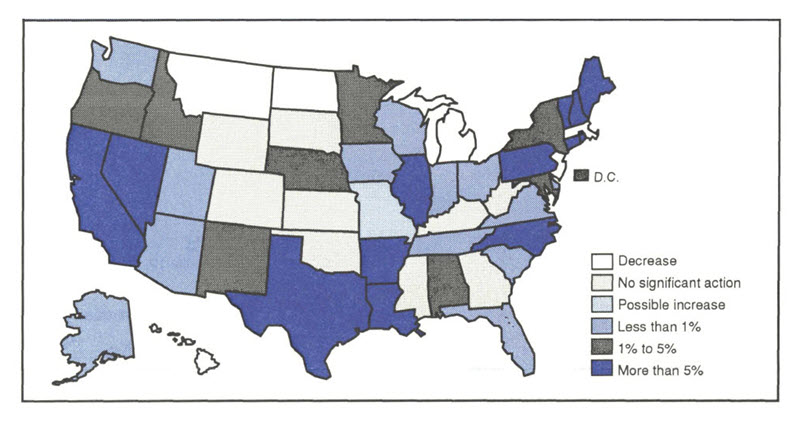
In total, these 10 states account for slightly over $12 billion of the $16 billion total increase. California alone accounts for nearly 40% of the total tax hike. Looking toward the future, it remains to be seen whether stimulative federal fiscal policy or growth in the overall economy will be able to overcome these state actions. Moreover, fiscal woe persists in several of these states despite these extraordinary actions. California is anticipating a $3 billion to $4 billion shortfall in the current fiscal year. Mounting problems have led Standard and Poors to downgrade that state’s general obligation bond rating to AA from AAA. Connecticut, despite passing a controversial personal income tax, has accumulated a $175 million budget gap in FY92.
The importance of timing
The state and local government’s response to recession since World War II has not typically been to aggravate business downturns. Rather, the sector maintains or even enhances its prior spending behavior—at least during the quarters immediately following the peak in the business cycle. Figure 4 illustrates the fact that states often succeed in maintaining aggregate spending levels for several quarters following the onset of a recession, even in the face of declining receipts. States are able to do this by drawing down budgeted reserves and by using budgetary maneuvers so as to forestall program cuts or tax hikes.1 Thus, state and local governments are able to behave countercyclically in response to the early stages of economic downturns.
4. State and local expenditures and receipts
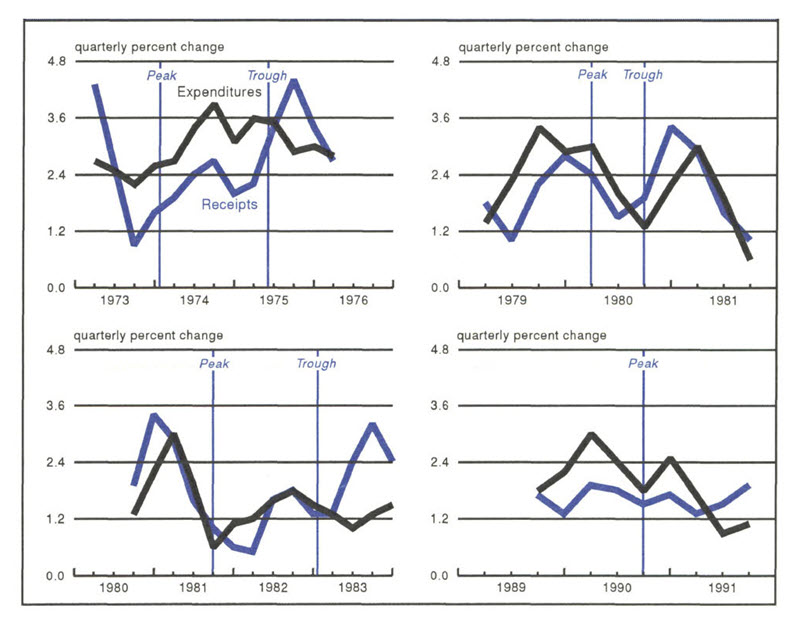
Source: Bureau of Economic Analysis, Department of Commerce, NIPA.
If the downturn drags on too long, however, state fiscal behavior may change direction. As budget reserves and fiscal maneuvers are exhausted, states must ultimately rebuild their reserves or pay down accumulated debt by means of tax rate hikes and spending restraint.
As characterized by the current situation, the issue of timing becomes critical to a struggling economy. If states delay long enough before succumbing to these steps, the tax increases and spending cuts can become effective during recession or during the early stages of economic recovery. Historically, the impact of these delayed actions on the overall economy has often been diluted by the general surge in the U.S. economy during economic recovery. This time around, the timing has been far less fortunate. Tax increases and spending cuts are taking hold while the economy is struggling to regain its balance. With the state and local sector still out of balance, future tax increases and spending cuts have the potential to mute the stimulative effect from federal actions, particularly given the growing significance of the state and local sector relative to the federal budget.2
Seventh District developments
One parallel to the current situation developed in Seventh District states during the double-dip recession of 1980 and 1981-82. Despite declining revenues and a rocky economy, none of the District states raised taxes during the 1980 recession. By FY81, conditions had deteriorated, but again the states forestalled severe adjustments by using budget transfers, acceleration of revenue collection, and minor spending cutbacks. It was not until after the November 1982 elections that District states enacted sweeping tax changes, with all of the states raising either their sales or income tax. Most of these tax hikes went into effect on January 1 of 1983. Since the trough of the business cycle was reached in the fourth quarter of 1982, the tax hikes took hold during recovery. By delaying the tax hikes, the negative effects of the tax increases were felt during a period of strong economic recovery. Fortunately, the strength of the recovery in 1983 was such that growth in the rest of the economy more than swamped the drag from the states’ fiscal actions.
This time around, District governments have again delayed their response to economic slowdown. Despite fiscal stress, tax increases have been restrained across the District. Even Michigan, which developed a sizable and nationally recognized budget gap, has generally avoided tax increases. However, continued and in some cases deepened economic sluggishness is now straining state government budgets to the limit. Both Illinois and Michigan have developed mountainous backlogs of unpaid bills for current services while revenues continue to slump. As a result, fiscal adjustments are becoming more profound. For example, Illinois recently passed a package of $273 million in budget cuts and $500 million in borrowing in order to shore up the FY92 budget. However, with Michigan’s fiscal year not yet at its midpoint, the state has yet to embrace such fiscal action. Still, the state budget office has estimated a potential deficit of $271 million and a reduction in the forecasted rate of revenue growth for the year.3 Discretionary tax hikes or program cuts to shore up the states’ finances could also end up further encumbering the region’s struggling economy.
Conclusion
With renewed interest in using federal fiscal policy to stimulate the economy, it is important to consider the large and growing influence of state and local government. Historically, state and local fiscal behavior has tended to act as a drag on the nation’s economic growth during the early stages of recovery from recession. With the increased influence of the sector and a sluggish recovery, the impact of this behavior may be more noticeable now than it has been in the past. State and local actions such as employee layoffs, tax increases, and expenditure cuts can have a constraining effect on the economic recovery, particularly in those states where the recession has been the deepest and the fiscal reaction the sharpest.
MMI-Midwest Manufacturing Index: Current expansion
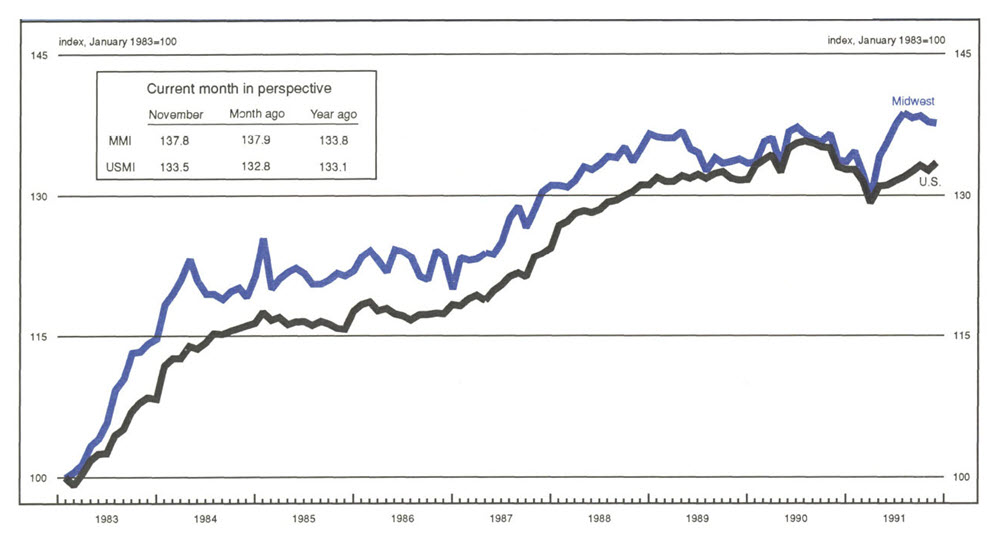
Manufacturing activity in the Midwest declined slightly (0.1%) in November, marking the second consecutive month of decline after four straight months of advancement. The weakness was concentrated in the transportation sector, which declined sharply in recent months. However, the machinery sector was also off slightly from recent monthly levels.
In contrast to the region, manufacturing activity in the nation rebounded in November (up 0.5%) from its previous month’s decline. However, weakness in the U.S. transportation sector continued into November, and reports from the auto industry indicate that auto production continued to decline through the end of the year. If so, the November gain may be short-lived.
Note
1 See Richard H. Mattoon and William A. Testa, “State and local governments’ reaction to recession,” Economic Perspectives, Federal Reserve Bank of Chicago, March/April 1992, pp. 19-27.
2 Estimates have placed the stimulative value of the tax actions proposed by President Bush at $25 billion. This must be contrasted with the estimated $16 billion in state tax hikes in FY92.
3 Department of Management and Budget, State of Michigan, Patricia Woodworth, Director, December 30, 1991. Deficit estimate is based partially on legislation that has yet to be enacted. Passage of the legislation would reduce the estimated deficit.


