

The following publication has been lightly reedited for spelling, grammar, and style to provide better searchability and an improved reading experience. No substantive changes impacting the data, analysis, or conclusions have been made. A PDF of the originally published version is available here.
The passage of the Clean Air Act Amendments of 1990 (CAAA) has encouraged states to develop creative implementation plans in order to meet the ambient air quality standards that the act requires. In responding to this challenge, state regulators throughout the nation and particularly in the Midwest have developed a host of new programs designed to improve air quality while mitigating the economic costs of stricter compliance requirements. These programs range from market-based trading of emission credits to more traditional regulatory programs of the command-and-control variety.
This Chicago Fed Letter examines programs underway to improve air quality in the Midwest and provides an update on the progress of these programs. We discuss some of the initial problems that have surfaced as well as ways in which they are being addressed. In particular, we assess the progress to date in establishing emissions trading markets for point sources-a keen focus of state regulators in the search for creative ways of reducing emissions. Finally, we briefly explore the potential for developing regional, multi-state strategies for attainment.
How to meet the air standards?
One of the key challenges in meeting the requirements of the CAAA is designing programs that reflect the multitude of sources and types of pollutants being targeted for reductions. Figure 1 shows the sources of three major types of pollutants—volatile organic compounds (VOCs), nitrogen oxide (NOx), and carbon monoxide (CO)—for the area surrounding southern and central Lake Michigan. Pollution is measured in tons emitted per day by source category. The three main categories distinguished are point sources (for example, a smokestack of a power plant), area or nonpoint sources (such as bakeries, dry cleaners, or lawnmowers), and mobile sources (such as highway and off-highway vehicles, locomotives, aircraft, and marine engines). An effective strategy for achieving the required improvements in air quality must reflect this underlying distribution of pollutants across sources. That explains the wide range of programs states are debating to achieve compliance. In addition, state programs are trying to account for the geographic distribution of pollution as well as the atmospheric conditions that cause pollution problems to vary from day to day.
Programs for mobile sources
Mobile sources, particularly automobiles, are major contributors to each of the three classes of pollutants (see figure 1). Programs to address mobile source emissions are only beginning to receive the degree of regulatory scrutiny and innovative design that point source programs have. Those now being considered include:
- reformulated gasoline programs to offer cleaner-burning fuels for cars.
- enhanced state inspection programs to verify periodically that emissions of individual cars are below designated levels.
- “cash for clunkers,” a program to purchase and remove from service high-emitting cars and trucks built before 1982. Illinois state officials estimate that such a program could eliminate VOCs or NOx at a cost of about $2,500 per ton. That compares with $3,000 to $5,000 to achieve the same reduction from point sources.
- the employee commute options or ECO program. This program would reduce the number of cars on the road during rush hour by working with employers to create new commuting options for their employees. The program is targeted at large employers (single facilities employing more than 100) and aims to increase the number of passengers per car from the current 1.09 to an average of 1.36 for the severe nonattainment area in northeastern Illinois by 1998. According to projections, this would reduce the number of cars traveling to work at rush hour by 25% from the current number.
1. Emissions sources
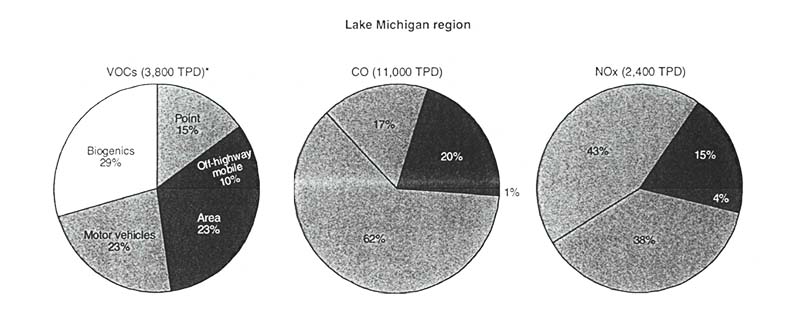
Source: Lake Michigan Air Directors Consortium, Ozone Modeling in the Lake Michigan Region, January 27, 1994.
Programs for point sources
Emissions trading programs use market-based incentives to induce firms to reduce emissions through flexible, firm-specific methods. Such programs enable firms to minimize the cost of compliance; they also reduce the regulatory agency’s burden, since the agency need no longer select appropriate technologies for the various industries. Trading programs are designed to reward firms that can reduce emissions beyond what they would achieve by using reasonably available control technology (RACT) or best available control technology (BACT), two standards requiring firms to use very specific technologies.
Among Seventh District states, Wisconsin has an emissions trading program in place for both VOCs and NOx. Michigan and Indiana are now working to develop similar programs.1 Illinois unveiled a NOx trading program in January 1994. However, in response to evidence from regional airshed modeling, efforts since then have concentrated on developing a trading program for VOC emissions instead.
Shortcomings of proposed programs
Mobile source programs to date have proven to have limited effectiveness. Technical standard regulations, such as California’s low-emission vehicle program enacted in 1990, require auto producers to install emission-reducing technologies.2 But the amount of emissions produced is a function of both the technology of the automobile and the public’s demand to drive. In fact, increased use of the automobile has outweighed improvements in emissions control technology for some time. In addition, most mobile source reduction programs target a relatively small portion of the driving public, so the resulting reductions in emissions are small and the potential costs to those who must comply are relatively large. For example, the ECO program requires employers with 100 or more employees in 10 severely polluted regions to design schemes for reducing solo driving by commuting employees. However, commuting accounts for only about one-third of miles driven. Furthermore, 88% of businesses employ fewer than l00 people.3 So too, the “cash for clunkers” program, while cost-effective and highly successful, yields a limited reduction in pollutants that will be exhausted once most of the high-emitting cars have been retired.
Point source regulation still needs to address several issues despite the fact that much effort has been spent on developing large-scale trading programs. The primary problem is that the science of pollution formation and the wishes of regulators do not always coincide. Local violations of the federal ozone standards are often the result of complex interactions among many different factors. For example, high ozone concentrations are the product of the amount of sunlight, the extent of regional air transportation, the quality of air coming into the area, and the relative presence of various pollutants. To determine whether reducing a particular class of pollutant will help an area achieve compliance with CAAA standards, states have examined the conditions that existed on days when the ozone standard was exceeded. Sophisticated modeling of such data may only begin to answer questions such as how much control of particular pollutants from particular sources under particular meteorological conditions is needed to prevent future ozone exceedances.
In the Great Lakes region, the Lake Michigan Air Directors Consortium has conducted what is referred to as the Lake Michigan Ozone Study (LMOS). The study’s findings to date demonstrate the complexity of meshing the science of air pollution with the implementation of regulatory programs. LMOS is examining four different historic episodes in which ozone levels were exceeded in an area that roughly bounds the land adjacent to the lower two-thirds of Lake Michigan. Simulations of the effects of reducing NOx and VOC emissions have been performed for two of the episodes. Regulators have been designing programs to implement NOx trading as an innovative method for complying with ozone standards. But in the two LMOS simulations, it was found that a significant reduction (30%) in NOx emissions would not have been enough to prevent the allowable ozone level of 120 parts per billion (ppb) from being exceeded. In fact, in one case, such a reduction actually would have increased the ozone concentration over much of the Chicago and southern Wisconsin area. This is because once NOx emissions pass a certain threshold, they can have a scavenging effect on the atmosphere, that is reduce the ozone level.
These results suggest that one needs to control both NOx and VOCs in order to achieve compliance with CAAA standards. Instead of the originally developed NOx trading program, Illinois EPA is currently putting the final touches on a program for trading VOC emissions.4 Unfortunately, one cannot simply rewrite the old proposal by substituting one pollutant for another, since not all types of emissions lend themselves equally well to trading. For example, only 15% of VOCs are generated by point sources, with a large percentage coming from socalled area sources, which include such everyday activities as using paint. Further complicating VOC trading are different types of VOCs, some of them toxic. This raises the question of whether trading would need to be restricted within specific types of VOCs.
A regional solution to a regional problem?
Air emissions regulation also must address what is referred to as a boundary problem—the fact that air is a transportable element whose quality can be affected by upwind sources. In the Chicago area, for instance, the quality of the inherited air is often quite poor. The two ozone-exceedance episodes examined in LMOS found the quality of air coming into the Chicago area to be only marginally below the standard used to indicate a violation of the federal ozone concentration level. This also means that areas that produce little pollution of their own can be in violation of ozone standards primarily because they inherit poor air from elsewhere. A good example of this is the second episode examined by LMOS. Between July 16 and 19, 1991, Sleeping Bear Dunes National Lakeshore in central Michigan recorded an ozone level of 170 ppb even though the area has few emissions sources.
Because air quality does not respect state or municipal boundaries, those who wish to control it must consider a regional, multi-state, or even national approach. Such an approach was chosen on the East Coast, where 12 states and the District of Columbia have set up a regional body called the Ozone Transport Commission in an effort to establish some shared rules and criteria to permit emissions trading in a multi-state market. Steps like this may go a long way toward reducing the aggregate cost of compliance, since according to current Clean Air Act rules, a downwind state that inherits poor quality air nevertheless must rigorously control emissions within its jurisdiction to ensure compliance.
In regard to emissions trading programs, an additional advantage to a multi-state regional approach is that it would increase the number of potential trading partners for each nonattainment area. Typically, trading is limited to a small number of large emitters within one nonattainment area. This problem could be remedied if firms could trade with other firms in other nearby nonattainment areas. Some have even suggested that under certain conditions, firms should be allowed to trade with firms in attainment areas.
Ironically, the disappointing finding about the potential benefits of local NOx reductions may actually facilitate regional cooperation. Illinois’s EPA director has suggested that a single-state strategy for meeting ozone attainment would require extreme steps such as controlling sources that emit as little as one ton—dry cleaners, for instance. This is because ozone levels entering the state are already high. By agreeing to adopt a joint strategy instead, Midwest states might avoid having to regulate very small sources at considerable cost. States have until April 1996 to submit such regional plans. Since many midwestern states missed the November 15, 1994, deadline for filing their attainment demonstrations, regional cooperation may be the best way to avoid the penalty of having federal highway funds withheld.
Setting up regional structures at this time seems particularly important if viable and lasting market trading systems are to be established. Markets work best when rules and regulations are clearly defined and understood. If a multi-state regional market seems an option worth pursuing, it makes sense to set up market rules that are compatible across state lines. This may include agreeing on such mundane issues as the unit of emissions to be used for trading purposes, the lifespan of reduction credits, and the permissibility of trading or banking credits. Making sure now that individual state markets are compatible can help keep regional markets a viable possibility.
Conclusion
This overview has shown states to be inventive in designing programs to comply with the emissions requirements of the CAAA of 1990. Nonetheless, it is clear that many challenges remain. While it is extremely difficult to address all the various causes of air pollution, it is important to pursue innovative, incentive-based programs in order to reach the goal of cleaner air.
Tracking Midwest manufacturing activity
Manufacturing output indexes (1987=100)
| August | Month ago | Year ago | |
|---|---|---|---|
| MMI | 135.0 | 133.2 | 120.0 |
| IP | 120.7 | 119.4 | 111.8 |
Motor vehicle production (millions, seasonally adj. annual rate)
| October | Month ago | Year ago | |
|---|---|---|---|
| Cars | 6.4 | 6.2 | 5.9 |
| Light trucks | 5.0 | 5.4 | 4.7 |
Purchasing managers’ surveys: net % reporting production growth
| November | Month ago | Year ago | |
|---|---|---|---|
| MW | 66.8 | 67.7 | 65.4 |
| U.S. | 66.1 | 64.1 | 59.1 |
Purchasing managers’ surveys (production index)
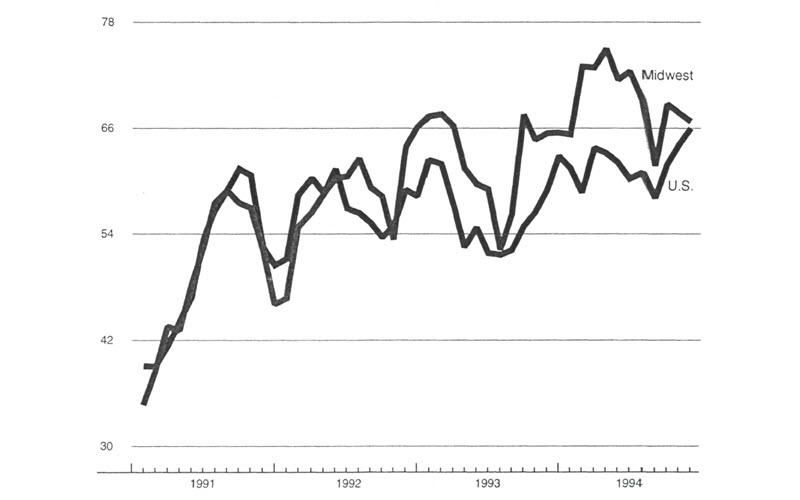
With 1994 drawing to a close, Midwest manufacturing output continues to expand at a brisk pace. The composite production index for purchasing managers’ surveys in Chicago, Detroit, and Milwaukee has been slowly trending downward in recent months, but only after reaching dramatically high levels in the second quarter. The Chicago survey showed a somewhat faster rate of growth in output in November, while the Milwaukee and Detroit surveys dipped slightly. However, these diffusion indexes continue to point to vigorous growth in the region’s industrial output, and at a somewhat faster pace than the national average.
Notes
1 An offset program allows new sources to locate in nonattainment areas only if they can “offset” their emissions by reducing emissions from existing sources, generally by a factor greater than one.
2 Under that program, California also requires auto manufacturers to sell a certain percentage of so-called zero-emission, that is, electric, vehicles starting in 1998.
3 Caleb Solomon, “Head-on collision,” Wall Street Journal, September 8, 1994, p. Al. Evidence from California’s regulation XV, a ride-sharing program implemented in 1988, indicates only very small increases in average vehicle occupancy at a cost between $10 and $86 per employee (Martin Wachs, “Clean air and transportation: California’s attempt to regulate commuter behavior,” lecture at Northwestern University, March 4, 1994).
4 A draft proposal was prepared by Illinois EPA with assistance from the volatile organic materials trading design team and was released in October 1994.


