

The following publication has been lightly reedited for spelling, grammar, and style to provide better searchability and an improved reading experience. No substantive changes impacting the data, analysis, or conclusions have been made. A PDF of the originally published version is available here.
At the end of 1995, light vehicle sales were forecast to remain in the doldrums after finishing a disappointing year. Sales last year had been expected to increase by 300,000 to 600,000 units over 1994's sales but finished at only 14.7 million units—400,000 units below the previous year's level. The failure to achieve those early expectations for 1995 set off an inventory correction that hampered the entire economy for most of the year.
As the new year began, little had changed in the fundamentals underlying the economy, offering few hopes for improvement in the auto market. The general outlook for light vehicle sales in 1996 started the year at 14.8 million units. However, as much as the first half of 1995 was a disappointment, the first half of 1996 has been quite strong. Sales through June averaged a seasonally adjusted annualized rate of 15.2 million units, with sales in some months reaching nearly 16 million units. However, sales from month to month have been so volatile that identifying an underlying trend has been difficult. On June 7, 1996, the Federal Reserve Bank of Chicago held its third annual Auto Outlook Symposium to discuss the prospects for auto sales in the second half of 1996 and in 1997. This Chicago Fed Letter summarizes the consensus outlook for auto sales from the symposium and looks at how the auto industry and its suppliers are adjusting to increasing global competition.
Consensus outlook for the economy
The economy in the first half of 1996 has proven to be somewhat stronger than suggested by the moderate growth projected for the year as a whole (see figure 1). Although real gross domestic product (GDP) in the first quarter grew by only 2.2%, it is anticipated to surge well in excess of 3% in the second quarter. In other words, the first half of the year should average a full percentage point more growth than expected for the year as a whole. For the year to average only 2.1% growth, as suggested by the consensus outlook, the economy would have to slow to a pace comparable to the weak first half of 1995—without the technical problems of an inventory correction that shaped the 1995 economy.
Actual 1995 and mean forecasts of GDP and related items
| 1995 | 1996 | 1997 | |
|---|---|---|---|
| GDP, chained 1992 dollars | 2.0% | 2.1% | 2.0% |
| Personal consumption expenditures | 2.4% | 2.5% | 2.1% |
| Business fixed investment | 6.1% | 5.5% | 3.4% |
| Residential construction | –2.3% | 0.8% | 0.7% |
| Change in business inventories ($ bil.) | $33.7 | $19.0 | $24.8 |
| Net exports of goods and services ($ bil.) | –$114.2 | –$111.5 | –$104.5 |
| Government purchases of goods and services | 0.1% | 0.2% | 0.5% |
| Industrial production | 3.3% | 2.2% | 2.4% |
| Car & light truck sales (millions— calendar year including imports) | 14.7 | 14.8 | 14.6 | Inflation rate (consumer price index) | 2.8% | 2.9% | 2.9% |
Inflation is expected to be relatively stable at just under 3%, which is actually higher than the rate of increase in new car prices over the last year. Indeed, it is remarkable that the relative price increases of most new vehicles have been flat to declining during one of the strongest sales periods of the current economic expansion. Given the macroeconomic setting implied by the consensus outlook for the second half of 1996, what are the prospects for auto sales for the rest of this year and next year?
Implications for auto sales
A rule of thumb in assessing the strength of the auto market over the last 30 years has been that annual light vehicle sales have never grown when real GDP has grown less than 2% (see figure 2).1 Moreover, with the notable exception of 1995, the only time auto sales have declined when GDP has grown between 2% and 3.5% has been right before or after a recession year (see area between dashed lines in figure 2). Thus, with the economy in 1996 expected to grow 2.1%, light vehicle sales should be expected to increase from their 1995 level of 14.7 million units. Indeed, the consensus forecast at the symposium was for sales of 14.8 million units in 1996 and (with GDP growth slowing to 2%) 14.6 million units in 1997. The forecasts were submitted before the strength of May sales was known, when year-to-date sales were averaging only 15 million units. The Big 3 automakers (General Motors, Ford, and Chrysler), which may have had better insight into May's sales pace, were a bit more optimistic, with 1996 sales forecasts between 15 million and 15.2 million units.
2. Change in light vehicle sales versus change in real GDP
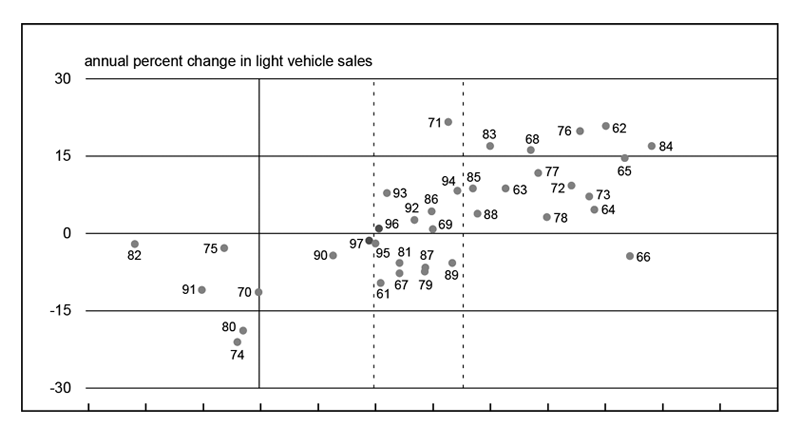
Supporting the Big 3's optimism have been light vehicle sales through the first half of the year—15.2 million units in both the first and second quarters. That translates into a gain of 3% in auto sales, which is consistent with 3% growth in the economy in the first half of 1996. Indeed, to achieve the consensus auto forecast for 1996 of only 14.8 million units, sales would have to average 14.5 million units over the second half of the year. That drop (of 4.6%) would not be out of line with the relatively anemic 1% GDP growth implied by the consensus forecast for the second half of the year. If the economy were to average 2.5% growth over the year rather than the consensus forecast of 2.1%, real GDP growth in the second half of 1996 would average about 2%. Maintaining the first half's pace would then seem more reasonable. However, since the economy in 1996 and 1997 is expected to be growing in that transition range of 2% to 3.5%, where auto sales could fall if the economy were at or near a peak, one has to take a closer look at the arguments made at the symposium to support the consensus forecast for lower sales in the second half of the year.
In addition to a moderately paced economy in the first half of the year, the symposium highlighted a number of factors that could boost auto sales. For one, mortgage refinancing spiked at the end of last year and beginning of this year. While this refinancing trend was minor compared to the refinancing booms of 1992 and 1993, some of the improvement in auto sales probably resulted from lower mortgage payments freeing up cash flow for consumers to spend on big-ticket items. Another factor was incentives, which were being boosted at the end of 1995 to clear out excess inventory, providing an advantageous price environment. Finally, a modest but steady decline in auto loan rates, from a high of almost 12% in April of last year to 9.6% in April of this year, led to lower monthly payments.
However, factors that helped auto sales in the first half of 1996 are likely to reverse in the second half. For example, incentives are expected to be pulled back now that inventories are lean again. Furthermore, long-term interest rates have begun to rise and could spill over into auto loan rates in the months ahead, leading to higher monthly payments. In addition, the rise in long-term interest rates shuts off any potential boost to sales from further refinancing activity. Whether these factors are sufficient to reduce sales to a 14.5 million-unit pace is far from certain, but the possibility of a second-half slowdown cannot be dismissed simply because sales in the first half were relatively robust.
However, the economy is offering scant evidence that a second half slowdown will turn into a cyclical peak for this expansion, suggesting that any slowdown in auto sales would be relatively mild.
Foreign competition in the U.S.
While analysts expect vehicle sales to be relatively flat over the forecast horizon, they believe the mix of sales will continue to shift away from imports. This shift has been underway throughout the current expansion. The strong dollar in the mid-1980s and an aggressive sales effort by Japanese producers led to an increase in sales of imported cars to over 3 million units per year, roughly 30% of total car sales between 1986 and 1988. However, by 1995 the dollar had fallen to about ¥100 from a high of ¥250 in 1985 and was one factor contributing to car import sales falling to 1.5 million units. In the second quarter of 1996, car import sales were running at a 1.3 million-unit pace.
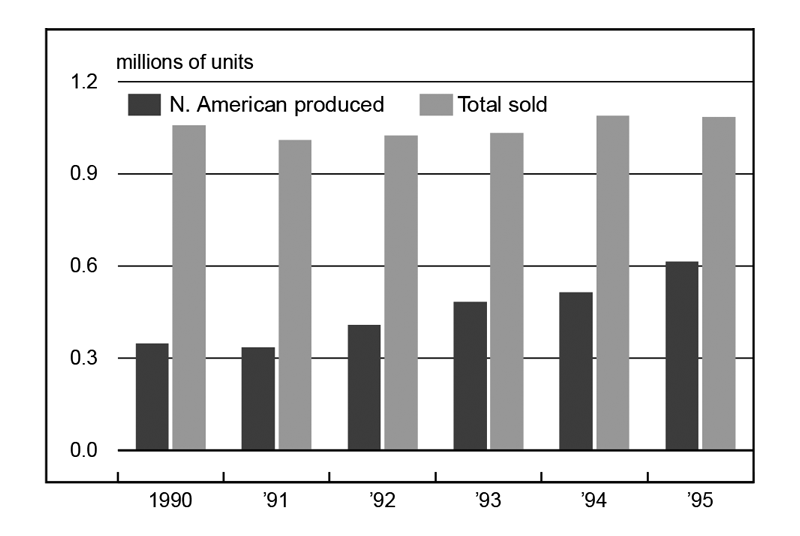
The decline in imports has not meant a decline in foreign competition. Foreign producers have steadily been following a deliberate policy (independent of the yen) of increasing production in the U.S., often with the intent of exporting back to their home markets (see figure 3). For example, Toyota's share of U.S. sales coming from its North American plants went from 33% in 1990 to 57% in 1995, an increase of over 260,000 cars—roughly the production of one assembly plant. Toyota, which has nine auto facilities in North America and is building its third auto assembly plant (to be located in southern Indiana), sold 1.06 million cars in the U.S. in 1990 and 1.08 million in 1995. In addition, Toyota increased exports out of its North American facilities from 19,000 in 1990 to 68,000 in 1995 (over half going to Japan). If the dollar continues its recent pattern of strengthening, those exports could be redirected to the U.S. market. Perhaps with this in mind, Toyota's third assembly plant will be designed to produce light trucks—a market that has been difficult for foreign producers to enter because of stiff import tariffs on light trucks.
3. U.S. vehicle sales by Toyota
Restructuring among suppliers
The increase in foreign competition has had a profound impact on auto suppliers, as well as auto producers. Fierce competition from European and Asian producers has forced Big 3 producers to seek continuous cost reductions from their major suppliers. Initially, as foreign auto producers began to establish plants in the U.S., they tended to import parts from their established suppliers. Many of these suppliers located plants in the U.S., which increased the competitive pressures on domestic auto suppliers. As the dollar weakened and political pressures built, however, foreign auto producers began increasingly to purchase parts from domestically owned auto suppliers. For example, in 1996, Toyota is expected to increase its purchases from U.S. suppliers to $6.45 billion from $2.6 billion in 1990.
U.S. auto suppliers have to meet global standards of quality to achieve core-supplier status with primary automakers. Beyond investing in more efficient capital, domestic suppliers have increasingly been seeking cost reductions through economies of scale that merging with competitors can provide. The perception among many suppliers is that to become a core supplier to a global automaker, the supplier must surpass a threshold of $1 billion in annual revenues. In 1995, there were over 130 mergers in the auto supplier base. In the first four months of 1996, over 50 mergers were announced. In addition, suppliers are expected to take greater responsibility for project management and parts development, rather than simply producing from blueprints for the original equipment manufacturer (OEM). The suppliers benefit from consolidation not only by reducing costs but by capturing more of the value added (ultimately profits) in the process of producing a vehicle.
The requirements for becoming a global-class supplier are leading to dramatic changes in the structure of the supplier industry, which can only be met by well-capitalized suppliers. There are currently about 2,500 first-tier auto suppliers worldwide (see figure 4). In addition, there are about 280,000 second- and third-tier suppliers. By the end of this decade, the number of first-tier suppliers is expected to be cut in half. In the short term, the results are likely to be lower production costs for automakers and lower prices for consumers. In the long run, the risk is that the concentration of suppliers will increase their leverage on automakers, which may have fewer options for finding alternative suppliers. (Witness the March brake plant strike that shut down General Motors.) This could ease the pressure on suppliers to cut costs, reducing automakers' ability to cut prices. Ideally, competitive pressures should be balanced in such a way that the auto and supplier industries can remain profitable, while price increases can continue to be constrained.
4. Historic industry model
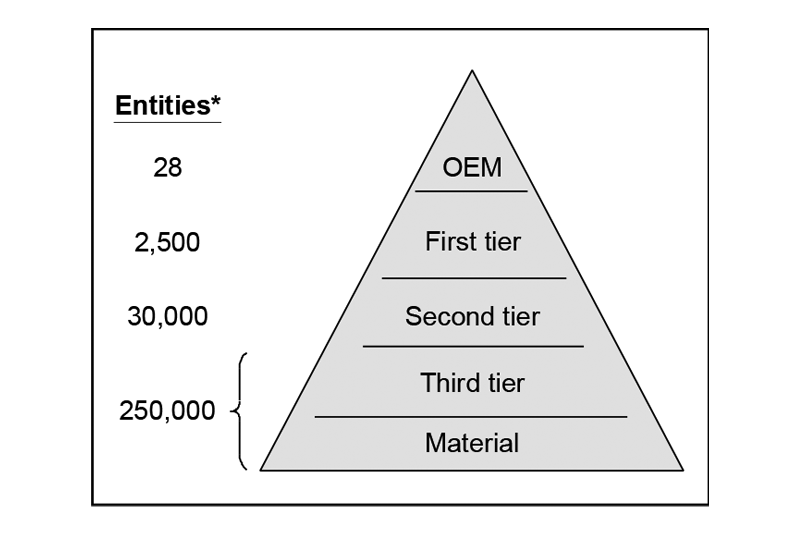
Source: University of Michigan, Office for the Study of Automotive Transportation, presentation at “Auto Outlook Symposium,” June 7, 1996.
Concluding remarks
Trend growth in light vehicle sales has been slowing for some time, and competition for future market share is certain to be intense. Sales in 1996 and 1997 are expected to be only slightly above trend level. In order to become more profitable, automakers have little choice but to lower their costs. In the process, they are reshaping not only their industry but also the entire supplier network. To date, these changes have helped to constrain the rise of new vehicle prices. As consolidation in the auto supplier industry advances, however, and the number of suppliers becomes more limited, the ability of automakers to push costs down may diminish along with their ability to constrain their own prices.
Tracking Midwest manufacturing activity
Manufacturing output indexes (1987=100)
| May | Month ago | Year ago | |
|---|---|---|---|
| MMI | 147.7 | 146.6 | 141.1 |
| IP | 127.2 | 126.5 | 123.2 |
Motor vehicle production (millions, seasonally adj. annual rate)
| June | Month ago | Year ago | |
|---|---|---|---|
| Cars | 6.6 | 6.4 | 6.1 |
| Light trucks | 5.5 | 5.4 | 5.4 |
Purchasing managers' surveys: net % reporting production growth
| June | Month ago | Year ago | |
|---|---|---|---|
| MW | 60.7 | 62.0 | 52.4 |
| U.S. | 55.4 | 52.6 | 45.7 |
Manufacturing output indexes, 1987=100
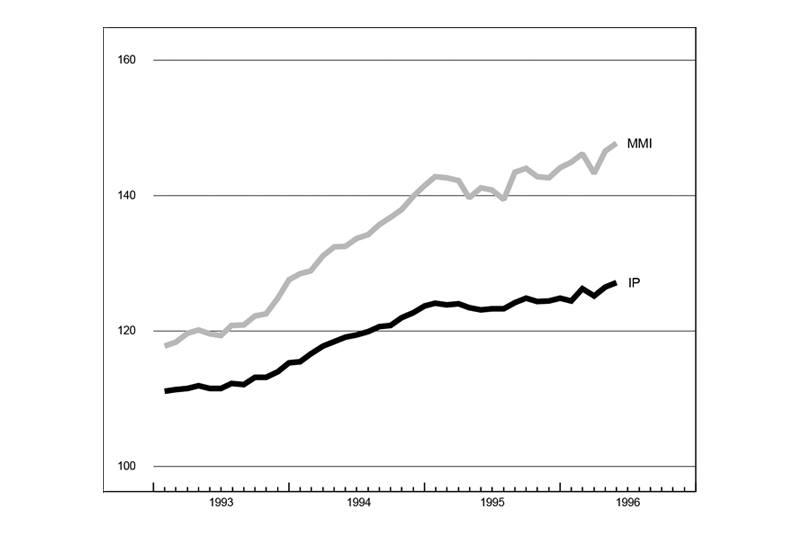
Midwest manufacturing activity increased 1.1% in May, versus 0.7% in the nation, as the region continued to rebound from the GM strike-induced dip in March. Year to date, however, the Midwest has also fared better than the nation, suggesting that recent gains were not all related to the strike's impact. The MMI was up 2.5% from its December level, while the IP was up only 1.9%. Still, the auto industry has been a key factor in both measures of activity, with auto assemblies in the second quarter rising at an annualized rate of over 50%.
Midwest purchasing managers' indexes in June generally signaled solid expansion in production over May levels, although the drop in the composite index to 60.7 suggested some slowing in that expansion. The production component of the national purchasing managers' survey jumped nearly 3 points to 55.4 in June, its highest level in over a year.
Notes
1 The years 1966 and 1967 were considered growth–recession years. The economy was not growing fast enough to absorb increases in the labor force, creating conditions in the auto market similar to periods when real GDP was actually declining.


