

The following publication has been lightly reedited for spelling, grammar, and style to provide better searchability and an improved reading experience. No substantive changes impacting the data, analysis, or conclusions have been made. A PDF of the originally published version is available here.
In cooperation with national and regional researchers, the Federal Reserve Bank of Chicago began an assessment of the Midwest economy in late 1995. The project’s primary mission was to document the dramatic turnaround in the region’s fortunes since the early 1980s and to analyze the changes underlying this turnaround. The project was motivated by the belief that regional prosperity has often proved fleeting and a thorough understanding of the internal and external factors in the region’s recovery would allow public and private policymakers to craft policies to sustain the Midwest economy. The study was designed to investigate the interrelationships and key emerging trends in such areas as globalization, labor force development, industry structure, government policy, and geographic shifts in industrial location. Public and private decisionmakers, academic researchers, and economists addressed these issues at a series of workshops held at the Bank.
This Fed Letter presents an overview of the study. A comprehensive Report of Findings was released on April 23 at a half-day conference featuring remarks by Federal Reserve Bank of Chicago President Michael Moskow and a keynote address by Illinois Governor James Edgar.1 In his address, Governor Edgar endorsed the findings and stressed that the study provides a blueprint for policymakers in Illinois as they try to maintain the economic momentum that has characterized the Midwest in the 1990s.
Recovery in the Midwest
Evidence abounds of the region’s economic recovery over the last ten years, ranging from state governments with record fund balances to recent population in-migration to resurgent strength in the region’s mainstay industries—manufacturing and agriculture. Perhaps the broadest measure of recovery can be found in the region’s labor markets, where the aggregate unemployment rate has been below that of the nation for five consecutive years (figure 1).
1. Unemployment rates
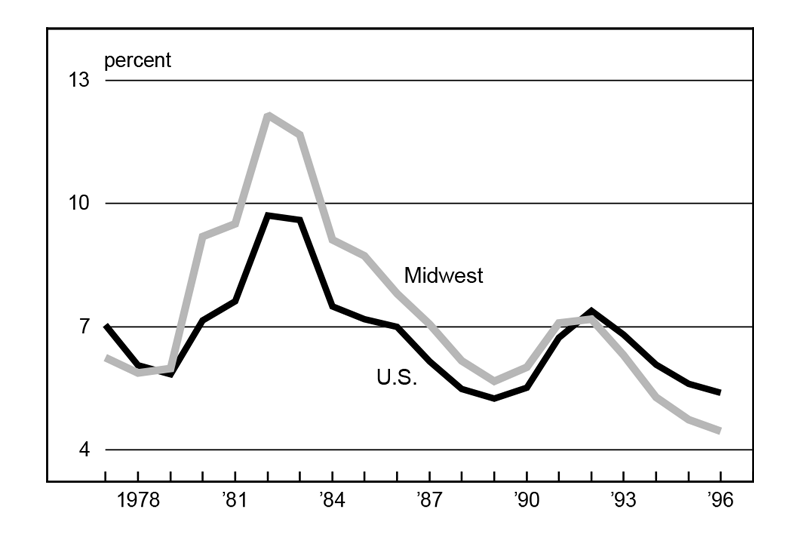
Source: U.S. Department of Labor, Bureau of Labor Statistics.
The breadth of this recovery has helped the Midwest shed its Rust Belt image and has brought renewed attention to the region. The Midwest is increasingly being recognized for innovation in both the public and private sectors, often in sharp contrast to its previously staid image
Why did the region recover?
The region’s recovery is the product of both favorable external forces that have boosted the prospects of key regional industries and internal policies by public and private sector decisionmakers that have positioned the region to respond to global competition and the difficult restructuring that faced the region’s economy during the Rust Belt days of the 1970s and early 1980s. Over the course of the study, the following internal and external factors were identified.
Internal factors
Technology and organization—The way that business is conducted in the region has changed in terms of business organization, mode of operation, and the application of technology. For example, the application of lean manufacturing technologies is contributing to the region’s manufacturing revival.
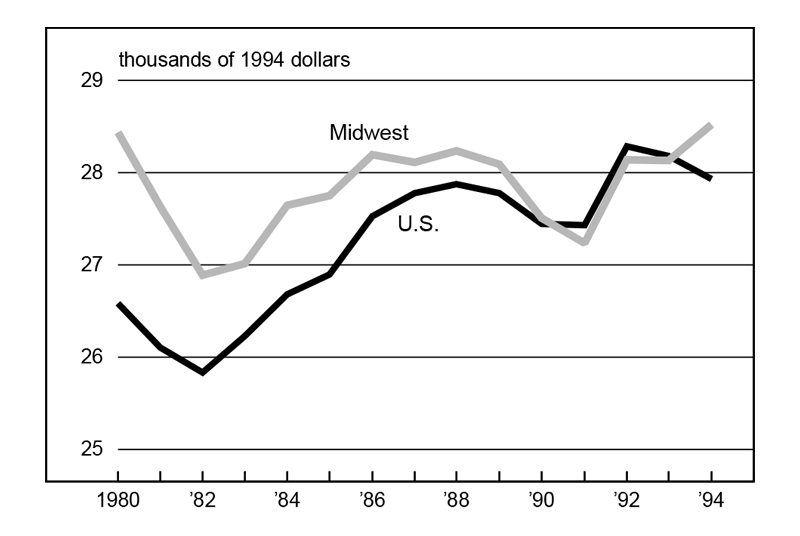
Costs of business operation—The Midwest has changed its image as a high-cost place to do business. In recent years, wage and energy costs have tended to converge with national averages, in contrast to the 1970s and early 1980s when these costs were well above national averages (figure 2).
2. Real per worker earnings
Public sector policies—Midwest states have pursued prudent fiscal policies that have restored state fund balances, while developing a national reputation for innovative policy efforts in areas such as school funding and welfare reform.
Institutional capital—Midwest states have a rich array of public and private organizations that can help improve the quality of decisionmaking in the region. Groups ranging from chambers of commerce to industry trade groups, to councils of government, and to public and private research groups all help identify critical policy issues that need to be addressed to sustain the economy.
External factors
Production location in the auto industry—U.S. auto assembly plants have tended to reconcentrate in the Midwest in the 1990s. A change in the industry’s product mix has changed the economics of plant location in favor of the midsection of the nation. The number of auto assembly plants in the region actually increased from 27 in 1979 to 31 in 1996.
Federal spending patterns—Recent reductions in federal spending, particularly related to defense, have not hurt the region. While the West Coast and New England have faced the difficult task of restructuring their economies away from a heavy reliance on defense industries, the Midwest has avoided this restructuring to a significant degree. In addition, the region’s mix of defense-related industries suggests that conversion of these firms to manufacturing civilian products might be easier in the Midwest than in other regions.
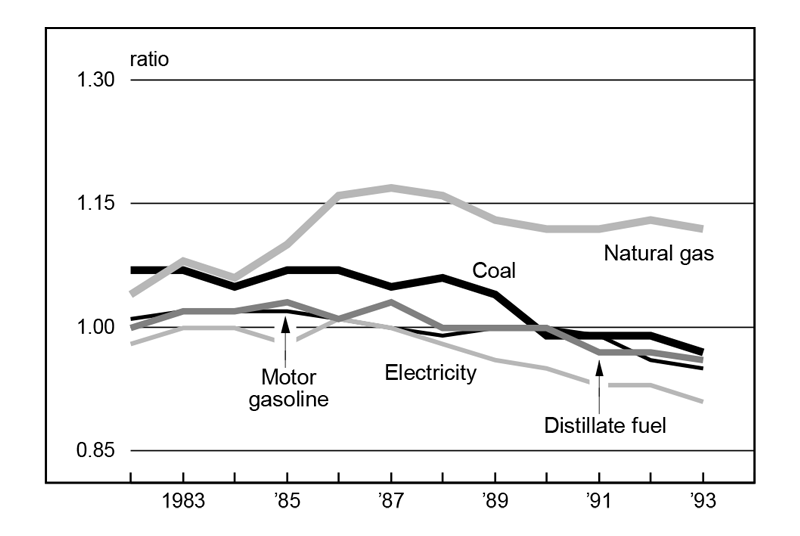
Energy—Delivered prices of all major fuels to the Midwest have declined since the mid-1980s (figure 3). Given the energy-intensive nature of the Midwest economy, lower energy costs have clearly contributed to the region’s rebound.
3. Ratio of Midwest to U.S. fuel prices
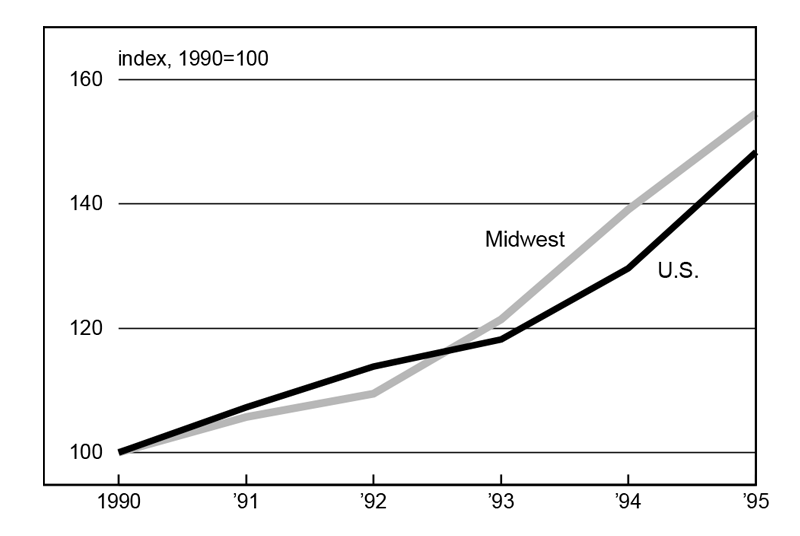
Exports—Exports have become more important to the U.S. economy. With its mix of capital goods and agricultural products, the Midwest has proven particularly adept at taking advantage of this trend (figure 4). Evidence produced as part of this study suggests that the region’s success in increasing exports to key trading partners owes more to improved regional productivity
4. Total exports
The Midwest at a crossroads
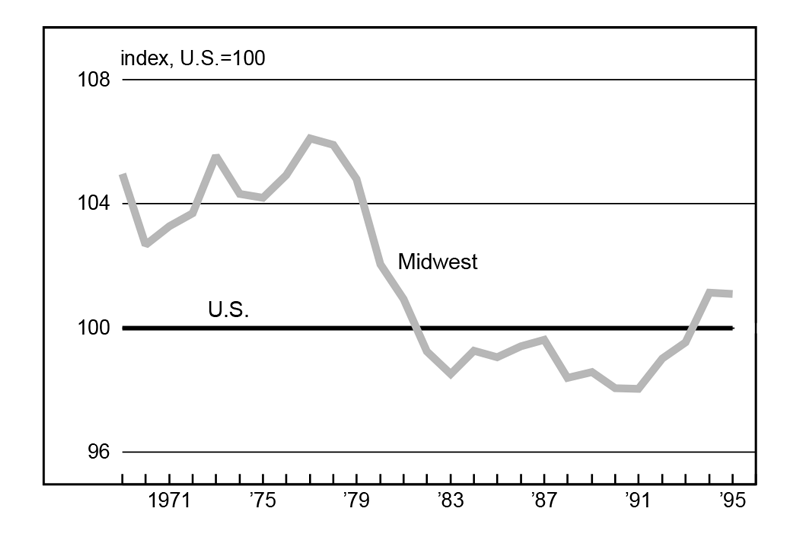
Despite the fundamental changes that have put the Midwest on a higher growth path, this confluence of good fortune cannot be expected to continue indefinitely. Throughout this project, analysts identified key challenges that the region must address if it is to continue to prosper. First, policymakers need to respond to the new economic order that has emerged from the region’s restructuring. For example, while manufacturing and agriculture have revived their competitive fortunes, these sectors continue to shed employees in favor of new technology. Similarly, while labor markets have tightened considerably, the region has yet to see a complete recovery in terms of per capita income (figure 5).
5. Midwest per capita income relative to U.S.
Other challenges relate to the continuing process of adapting to change. For example, two mainstay farm segments, hog and dairy production, have seen their national market shares of production erode as mega-farms and other production methods have favored other areas. Meanwhile, midwestern metropolitan areas, particularly highly populous ones, continue to move toward a more service-based economy. However, given older infrastructure, environmental contamination, and, often, a mismatch between the skills of the urban workforce and the needs of business, the conversion is often more challenging than in other parts of the country.
Finally, the Midwest, like all regions, faces the challenge of designing policies in an environment in which the federal government is actively devolving responsibility to the states. This will provide the region’s policymakers with more freedom to create region-specific policies, but it also will make them more dependent on region-specific resources.
Describing the policy strategies
Three themes from the Midwest Assessment project can serve as a regional blueprint for further analysis and action. These policy strategies are:
- An increased emphasis on education and workforce training;
- Greater attention to and evaluation of region-specific public policies; and
- Improving our understanding of and adaptation to changing industry technology, location preference, and internal restructuring, particularly as they affect urban and rural areas.
On the surface, these themes appear simple, but designing policy to enhance the region’s economy requires a careful understanding of the interconnections between these areas. In many ways, all of these themes reflect the importance of regional adaptation to globalization. As the world economy becomes more integrated and competitive, regional differences and policies become more important.
Understanding the three policy strategies
An increased emphasis on education and workforce training. As the world economy continues to place a higher premium on work force skills, particularly in fast growing, knowledge-based industries, a region’s ability to develop and attract the best possible workforce is key to its prosperity. It is particularly important that education and training models prepare individuals to be lifelong learners and that workers can adapt to changing labor market needs. Models for continuous improvement in the skills of current workers and effective education systems for elementary and secondary students are critical. In addition, programs need to be designed to bring the disadvantaged into the work force.
Greater attention to and evaluation of region-specific public policies. A significant portion of the Midwest’s trade of goods and services flows between states in the region. Therefore, reducing intraregional differences in occupational licensing, freight hauling standards, and tax and regulatory structures could provide significant economic advantages. In addition, efforts should continue to identify regional and international cost differentials that reduce the economic attractiveness of midwestern states and to reduce these costs based on sound economic principles. For example, the Midwest Assessment project found that taxes paid by businesses far exceeded the benefits of the services they received from government. Aligning business tax systems in a way that promotes government provision of value-added services to private production could spur economic development. Finally, regional policies need to address the continuing trend of devolving federal program responsibility to the states. This might include sharing information on the best practices for newly created state programs, such as welfare to work, and forming strategies to address issues facing the entire region, such as global trade agreements.
Improving our understanding of and adaptation to changing industry technology, location preference, and internal restructuring. Changing industry technology and internal restructuring are clearly playing major roles in determining the location of economic activity. In metro areas, technology is a critical factor in explaining the deconcentration of economic activity from the city to the suburbs and urban fringe. In rural areas, technology has spurred the development of manufacturing facilities, while permitting production agriculture to continue to increase farm yields with fewer workers. An understanding of these processes and their implications will allow the development of policies that can support economic growth rather than create barriers that would hinder the region’s ability to take advantage of economic change.
The need for regional information
The Midwest Assessment project has made it clear that regional information is critical to the region’s continued prosperity. One-size-fits-all policy options will become less relevant as specific regional conditions and behaviors increasingly need to be taken into account in policy formation. It is equally important that this information be disseminated efficiently to decisionmakers in both the public and private sectors. The Midwest Assessment project represents the first step in this process.
Tracking Midwest manufacturing activity
Manufacturing output indexes (1992=100)
| March | Month ago | Year ago | |
|---|---|---|---|
| CFMMI | 126.7 | 125.8 | 116.8 |
| IP | 121.4 | 120.4 | 113.9 |
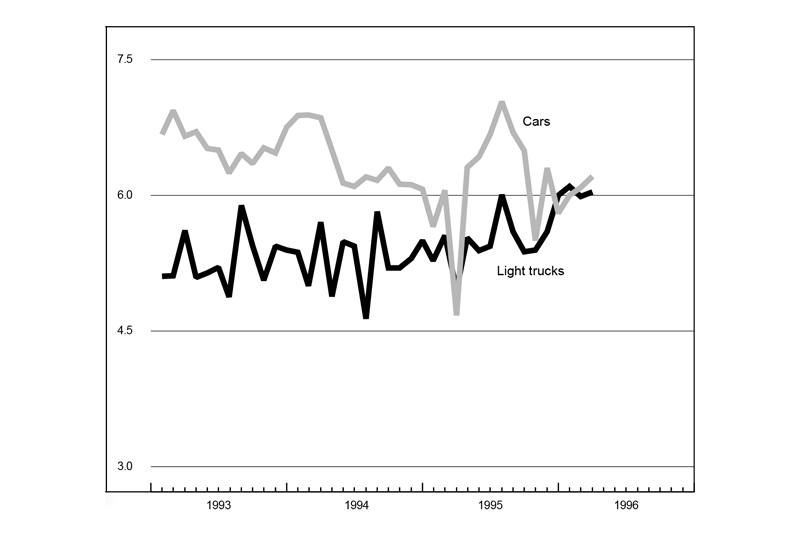
Motor vehicle production (millions, seasonally adj. annual rate)
| March | Month ago | Year ago | |
|---|---|---|---|
| Cars | 6.2 | 6.1 | 4.7 |
| Light trucks | 6.0 | 6.0 | 5.0 |
Purchasing managers' surveys: net % reporting production growth
| April | Month ago | Year ago | |
|---|---|---|---|
| MW | 62.5 | 63.0 | 58.4 |
| U.S. | 56.6 | 56.8 | 51.4 |
Motor vehicle production (millions, seasonally adj. annual rate)
The Chicago Fed Midwest Manufacturing Index (CFMMI) rose 0.7% in March, slowing slightly from a 1% increase in February. The Federal Reserve Board’s Industrial Production Index (IP) for manufacturing increased 0.9% for the same period.
Motor vehicle production was relatively unchanged, with car production in March increasing to 6.2 million units on a seasonally adjusted annual rate. Light truck production remained constant at 6 million units. However, the purchasing managers’ survey for production declined from March to April for both the U.S. and Midwest.
Notes
1 See William A. Testa, Thomas H. Klier, and Richard H. Mattoon, Assessing the Midwest Economy: Looking Back for the Future, Report of Findings, Federal Reserve Bank of Chicago, April 1997.


