

The following publication has been lightly reedited for spelling, grammar, and style to provide better searchability and an improved reading experience. No substantive changes impacting the data, analysis, or conclusions have been made. A PDF of the originally published version is available here.
The Federal Reserve Bank of Chicago’s 12th annual Economic Outlook Symposium, held on December 4, 1998, focused on how international issues might affect U.S. economic growth in 1999. More than 60 economists and analysts from business, academia, and government attended the conference. In this Chicago Fed Letter, we review the accuracy of last year’s conference forecast for 1998 and summarize the outlook for 1999.
Consensus outlook for the economy
In 1998, the economy showed tremendous strength in the first quarter, growing 5.5%. This was the strongest quarter of growth in nearly two years. Growth slowed to a relatively weak 1.8% in the second quarter, due largely to the General Motors strikes. The strikes lowered vehicle production beginning in June and, combined with strong sales, caused light vehicle (cars and light truck) inventories to reach fairly low levels. As a result, the change in business inventories, which had been averaging over $56 billion per quarter for the previous two years, reached only $38.2 billion in the second quarter, reducing real gross domestic product (GDP) growth by 1 percentage point. The GM strikes were settled by the end of July and production began to rebuild both sales and inventories. Third quarter GDP (fourth quarter numbers are not yet available) rose by a strong 3.7% as the change in business inventories approached the rate it had averaged over the previous two years. If the second and third quarters are averaged, then GDP growth falls into the range that traditionally has been associated with its long-run trend of close to 2.5%.
In the first half of 1998, the Asian crisis made its presence felt. Manufacturing output growth began to soften and industrial production, which had been averaging nearly 6% growth during 1997, slowed to 1.5% in the first half of the year and 0% in the third quarter. Nonetheless, unemployment rates remained low, at 4.4% in the second quarter and 4.5% in the third quarter. Inflation concerns also remained subdued, with inflation averaging 1.4% for the first three quarters of 1998.
In the third quarter, international issues continued to dominate the economic risk horizon. Concerns about the collapse of the Russian economy and the impact it might have on other economies caused significant disruption in world financial markets. Interest spreads, the difference between Treasury securities and more risky types of assets, such as corporate securities, increased substantially and economists in the U.S. raised concerns about a potential credit crunch. Partly in response to these concerns, the Federal Open Market Committee lowered the federal funds rate three times over a seven-week period beginning in late September, for a total rate reduction of 75 basis points.
Looking over our shoulder
In general, participants in the December 1997 symposium underestimated the strength of the economy in 1998. They expected real GDP to increase by 2.6%; for the first three quarters, it averaged 3.7%. This tendency to underestimate growth held for most of the subcategories of GDP. The 4.3% growth rate of industrial production for the first three quarters of 1998 compared with the first three quarters of 1997 was higher than the 3.5% rate forecast last year. Light vehicle sales averaged roughly 400,000 units more than forecast. Housing starts added 1.59 million units (annualized) in the first three quarters of 1998 versus a forecast of 1.41 million units rate for the year, following a very strong year in 1997. The trade-weighted dollar appreciated more than 6% for the first three quarters, compared with an anticipated increase of 1%. Analysts overestimated unemployment rate growth by 0.4 percentage points. They expected inflation to remain at a 2.4% rate in 1998, but inflation averaged 1.4% for the first three quarters of 1998. The prime rate was forecast to rise, reaching 8.75% in the fourth quarter and averaging 8.70% for the year. Instead, rates fell for most of the year and the fourth quarter prime rate was 100 basis points lower than forecast, at 7.75%. In summary, the economy expanded faster, inflation was significantly lower, and unemployment rates were lower than last year’s symposium forecast suggested.
Looking ahead to 1999
For 1999, the symposium forecasts show the economy’s growth slowing in the first half of the year and then expanding at a faster pace as the year draws to a close. Figure 1 summarizes full-year forecasts for 1998 and 1999. Most forecasters believe that the growth rates experienced in 1998 are unsustainable and that real growth will be lower in 1999 for almost every subcategory of GDP. The typical forecasts are for real GDP growth of 3.6% in 1998 and 2.1% in 1999. Analysts expect concerns about financial and international conditions to reduce consumer spending from 1998’s very strong level of nearly 5% to just under 3%. Business fixed investment growth is anticipated to be more than halved from 11.4% during 1998 to just over 5% in 1999. Residential construction, which is expected to post a very strong gain for 1998, is forecast to increase by just 0.8% during 1999. With continued economic weakness abroad, analysts expect the trade deficit to continue to grow in 1999, although at a slower pace than in 1998. The government sector is expected to show slightly stronger growth, at 1.6% versus 0.8% in 1998.
1. Actual 1997 and median forecasts of GDP and related items
| 1997 | 1998 | 1999 | |
| (Actual) | (Forecast) | (Forecast) | |
| Real gross domestic product | 3.9 | 3.6 | 2.1 |
| Real personal consumption expendituresa | 3.4 | 4.7 | 2.8 |
| Real fixed investment, nonresidentiala | 10.7 | 11.4 | 5.1 |
| Real fixed investment, residentiala | 2.5 | 9.4 | 0.8 |
| Change in business inventoriesb | 63.2 | 59.3 | 46.6 |
| Net exports of goods and servicesb | –136.1 | –246.5 | –300.0 |
| Real government consumption expenditures and gross investmentsa | 1.3 | 0.8 | 1.6 |
| Industrial productiona | 5.0 | 3.1 | 1.9 |
| Auto & light truck sales (millions of units) | 15.0 | 15.4 | 14.8 |
| Housing starts (millions of units) | 1.48 | 1.60 | 1.50 |
| Unemployment ratec | 5.0 | 4.5 | 4.8 |
| Inflation rate (Consumer Price Index)a | 2.3 | 1.6 | 2.0 |
| 1-year Treasury rate (constant maturity)c | 5.63 | 5.02 | 4.57 |
| 10-year Treasury rate (constant maturity)c | 6.35 | 5.29 | 5.00 |
| J. P. Morgan trade-weighted dollar indexa | 8.0 | 3.0 | -3.2 |
bBillions of chained (1992) dollars.
cPercent.
Note: Data as of December 4, 1998.
With relatively slower growth in real GDP, analysts expect industrial production growth to slow from 3.1% anticipated for 1998 to 1.9% forecast in 1999. After another solid year in 1998, the light vehicle market is expected to sell 600,000 fewer units in 1999. Housing starts are forecast to moderate to a still robust 1.5 million-unit pace. Analysts forecast the 1999 unemployment rate to average three-tenths of a percentage point above the 1998 rate. The rate of inflation is forecast to increase slightly from 1.6% to 2%. One-year Treasury rates are expected to be 45 basis points lower and ten-year rates 29 basis points lower, on average, in 1999 than in 1998. Finally, the trade-weighted dollar is anticipated to fall by 3.2%.
In terms of the quarterly pattern for real GDP growth, the forecast group is expecting a downward trend through the second quarter of 1999, with 1.8% growth in the first quarter slowing to 1.6% in the second. They anticipate a slight increase through the second half, to 2.3% in the third quarter and 2.6% in the fourth quarter (see figure 2). This pattern is reflected in the growth outlook for personal consumption expenditures, business fixed investment, residential investment, and government spending. Some weakening is expected in change in business inventories and net exports.
2. Real GDP growth
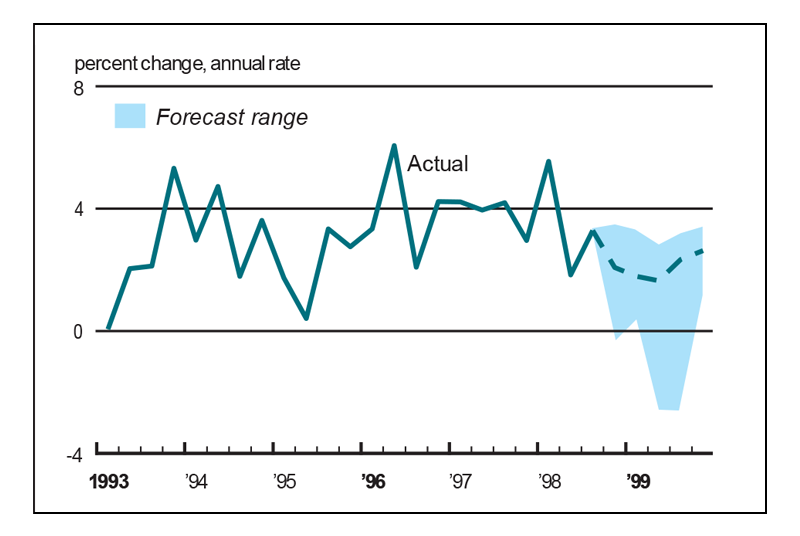
Source: U.S. Department of Commerce, Bureau of Economic Analysis.
The quarterly pattern for industrial production growth is expected to be similar to the overall pattern of GDP growth. The quarterly patterns for light vehicle sales and housing starts are also similar to the pattern for real GDP, but the growth trough occurs in the third quarter. The unemployment rate and inflation rate are anticipated to rise over the four quarters of 1999. The one-year Treasury rate is forecast to bottom out at 4.41% in the first quarter and rise for the remainder of the year, reaching 4.55% in the fourth quarter. The ten-year Treasury rate is expected to fall to 4.80% in the second quarter and rise to 5.07% in the fourth quarter.
Outlook for light vehicle sales
A chief economist from an automotive manufacturer expects vehicle sales to continue positive but at lower levels in 1999 and 2000. This economist does not see any signs of consumer retrenchment due to high debt levels and suggested that given the appreciation in home values, consumers feel richer, and this wealth effect has kept consumer spending strong. For North America, the economist anticipates a drop from above trend growth in 1998 to slightly below trend growth in 1999. Strong domestic demand should offset some of the impact of the emerging market crises. South America has been heavily affected by the financial turmoil in Asia and Russia. Europe is less dependent on trade with Asia and European economic growth should be close to trend in 1999. Emerging markets in Asia will experience another down year.
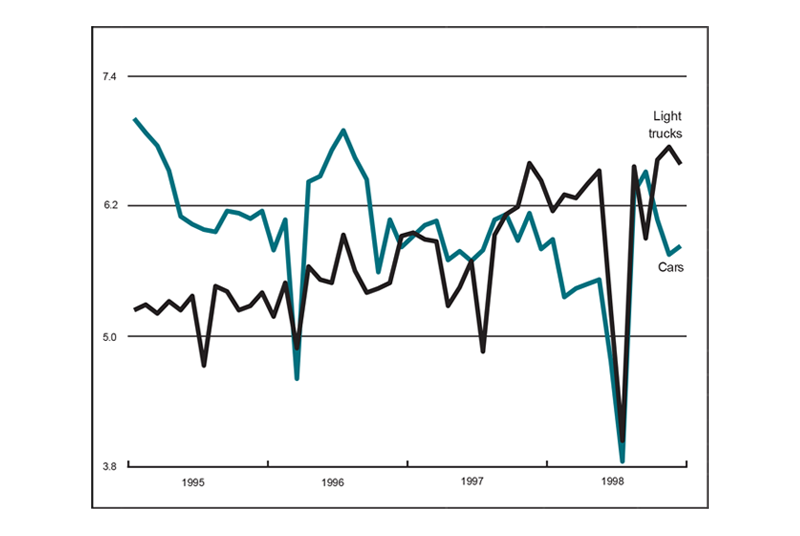
Sales of U.S. new vehicles, which have been above trend since 1994, are expected to be lower in 1999 at 14.5 million units. Overall, U.S. new vehicle sales growth is forecast to be close to trend in 1999 at 2.1% versus 3.6% in 1998. Vehicle ownership per household continues to grow, and light trucks are rapidly approaching 50% of new vehicle sales, supported by falling oil prices. The extremely competitive pricing environment is likely to continue in 1999. New vehicle transaction prices are forecast to decline by 1% in nominal terms and used vehicle prices to continue to improve.
Housing sector outlook
A major housing group association spokesperson offered a very strong outlook for the sector in 1998 with slower growth in 1999, supported by low interest rates, high home ownership rates, high consumer confidence, and modest inflation. Growing sales to immigrants and rising ownership rates among an aging population should also lead to higher home sales.
Retail forecast
A specialist from the retail industry painted a favorable picture of retail sales in 1999. Consumer spending during 1998 had been the best since 1994, based on total consumer expenditures on a year-over-year basis, with both goods and services doing well. Consumers are feeling confident. Durable goods sales have soared and nondurables have recovered from their weakness in 1997. Total furniture and household equipment, furniture, kitchen and household appliances, and most notably total video, audio, computers, and musical instruments are all doing well compared with 1997. All toy categories appear be doing well, with do-it-yourself toys leading the pack. Apparel began 1998 very strong but weakened as the year came to a close. Overall, analysts expect the holiday selling season to be relatively good and positive retail sales to continue into 1999. Inflation is not seen as a problem for durable goods sales. Capacity constraint problems exist mostly on the West Coast, but major companies have shipped inventory from the East Coast to resolve these problems. Price is considered the most important issue for consumers, and it is influencing where they spend their money.
Financial sector outlook
A chief economist for a financial services firm described economic fundamentals as solid, including consumer spending, home sales, Midwest employment growth, and the Chicago Fed Midwest Manufacturing Index. Monetary policy signals, such as the fed funds rates, money growth, bank credit reserves, and the yield curve, do not appear to be signaling a recession. Although corporate profits are declining, which may be a leading indicator of a future recession, the impact on the economy would probably not be felt until 2000.
The economist cited substantial increases in interest spreads in September and October 1998 as another potential cause for concern. However, the economist notes that banks are becoming more cautious in lending practices; credit strains at banks remain low and, therefore, do not represent a major threat to the stability of the financial system.
Outlook for the steel industry
A consultant from the steel industry said the industry is suffering the negative effects of the economic crisis in Southeast Asia and other parts of the world. The consultant cited healthy gross domestic purchases as a signal that consumers are doing well in the current environment. Favorable projects for construction and the steel industry include highway and rapid transit, airports (and related access roads, hangars, and parking garages), school buildings, and municipal service projects (i.e., fire departments, police departments, and recreation facilities).
This consultant anticipates growth in construction in 1999, which should bode well for the U.S. steel industry.
Heavy equipment forecast
According to a senior economist at a heavy equipment producer, this industry like the steel industry is facing significant challenges. Low commodity prices are making it difficult to sell heavy equipment outside the U.S., as foreign companies are using their money to buy equipment produced locally. However, growth in 1998 was only slightly down from 1997 levels, and growth levels for 1999 should be in line with 1998, despite the impact of recessions in certain parts of the world. Equipment sales and profitability in the steel industry are very cyclical but have been growing at about 10% per year. The economist expects U.S. GDP growth of 2% to 2.5% in 1999, domestic demand growth of 3%, low inflation, lower profits and cash flows, a mixed outlook for mining (with sales flat or slightly up), a sharp downturn in agricultural equipment, and flat construction spending. Highways and public building should be up, with housing staying flat. These forecasts are pretty much in line with the consensus forecast discussed earlier. Overall, the economist does not see any growth for the industry in 1999. However, given that 1998 sales were strong, this economist suggests holding to those levels for 1999 would be fine.
Conclusion
The economic outlook for 1999 calls for slower economic growth than in 1998, coupled with relatively low rates of inflation and unemployment. Both light vehicle sales and housing starts are anticipated to be down from their 1998 levels, but still at fairly good levels. If this forecast is realized, 1999 will be the ninth year of one of the longest-lived economic expansions of the postwar era.
Tracking Midwest manufacturing activity
Manufacturing output indexes (1992=100)
| November | Month ago | Year ago | |
|---|---|---|---|
| CFMMI | 128.6 | 128.8 | 127.3 |
| IP | 135.9 | 136.0 | 123.3 |
Motor vehicle production (millions, seasonally adj. annual rate)
| December | Month ago | Year ago | |
|---|---|---|---|
| Cars | 5.8 | 5.8 | 5.8 |
| Light trucks | 6.6 | 6.7 | 6.4 |
Purchasing managers' surveys: net % reporting production growth
| December | Month ago | Year ago | |
|---|---|---|---|
| MW | 54.5 | 54.2 | 58.1 |
| U.S. | 46.8 | 48.5 | 56.1 |
Motor vehicle production (millions, seasonally adj. annual rate)
The CFMMI decreased 0.1% from October to November following a revised 1.3% gain in October. The IP was unchanged in November following an increase of 0.6% in October. Light truck production decreased slightly from 6.7 million units in November to 6.6 million units in December, and car production remained constant at 5.8 million units for November and December.
The Midwest purchasing managers’ composite index (a weighted average of the Chicago, Detroit, and Milwaukee surveys) for production increased to 54.5% in December from 54.2% in November. The purchasing managers’ index decreased in Milwaukee, but the indexes increased in Chicago and Detroit. The national purchasing managers’ survey for production declined from 48.5% to 46.8% from November to December.


