

The following publication has been lightly reedited for spelling, grammar, and style to provide better searchability and an improved reading experience. No substantive changes impacting the data, analysis, or conclusions have been made. A PDF of the originally published version is available here.
Light vehicle sales for 1994–97 were 15 million, 14.7 million, 15 million, and 15.1 million units, respectively. This relative stability in sales over four consecutive years is unprecedented for the auto industry. The light vehicle sales rate for 1997 was the highest yearly rate for the current expansion that began in 1991. With light vehicle sales of 15.1 million units in the fourth quarter of 1997 and 15 million units in the first quarter of 1998, it appeared that the sales pace of 15 million units would hold for quite a while. However, the selling pace in April and May, supported by heavy price incentive programs, increased substantially to 15.4 and 16.2 million units, respectively. On June 5, 1998, shortly after these numbers were reported, the Federal Reserve Bank of Chicago held its fifth annual Auto Outlook Symposium.
This Chicago Fed Letter summarizes the consensus outlook from the symposium as well as the presentations from vehicle producers, dealers, and vehicle research organizations.
Consensus outlook for the economy
The economy began 1998 on a strong note. In the fourth quarter of 1997, the economy had expanded at a 3.7% rate, and preliminary growth for the first quarter was a very strong 4.8%. The symposium participants expect the overall economy, as reflected by real gross domestic product (GDP), to grow by 3.1% for 1998 and then slow to 2.3% next year (see figure 1). The unemployment rate is anticipated to decline 0.4 percentage points to 4.6% in 1998 and then rise by 0.3 percentage points next year. The consensus forecast for light vehicle sales for this year, 15 million units, is just slightly below last year’s sales pace. Given that when these forecasts were made sales had already averaged 15.1 million units for the first four months of the year, the group was expecting sales to slow somewhat for the remaining two-thirds of the year. For next year vehicle sales are expected to slow somewhat, to 14.8 million units. Even with the relatively robust performance of the economy, the participants do not expect a rise in the rate of inflation. Inflation is expected to decline from 2.3% in 1997 to 1.8% this year and then rise to 2.5% in 1999. The inflation rate for new vehicles illustrates how competitive the light vehicle market is. In April new vehicle prices were 0.7% lower than a year ago. New vehicle prices have been in a deflation mode since September 1997.
1. Actual 1997 and median forecasts of GDP and related items
| 1997 | 1998 | 1999 | |
| (Actual) | (Forecast) | (Forecast) | |
| Real gross domestic producta | 3.8 | 3.1 | 2.3 |
| Real personal consumption expendituresa | 3.3 | 3.8 | 2.6 |
| Real fixed investment–nonresidentiala | 9.9 | 10.2 | 6.0 |
| Real fixed investment–residentiala | 2.7 | 7.7 | 0.7 |
| Change in business inventoriesb | 65.7 | 60.4 | 46.0 |
| Net exports of goods and servicesb | –146.5 | –215.3 | –236.0 |
| Real government consumption | |||
| expenditures and gross investmentsa | 0.9 | 0.6 | 1.6 |
| Industrial productionaa | 5.0 | 3.8 | 2.3 |
| Auto & light truck sales (millions of units) | 15.1 | 15.0 | 14.8 |
| Housing starts (millions of units) | 1.48 | 1.50 | 1.44 |
| Unemployment ratec | 5.0 | 4.6 | 4.9 |
| Inflation rate (consumer price index)a | 2.3 | 1.8 | 2.5 |
| 1-year treasury rate (constant maturity)c | 5.63 | 5.50 | 5.70 |
| 10-year treasury rate (constant maturity)c | 6.35 | 5.80 | 6.10 |
| J.P. Morgan trade weighted dollar indexa | 8.0 | 4.0 | –2.6 |
b Billions of chained (1992) dollars.
c Percent.
Note: Data as of June 5, 1998.
Merger mania
A chief economist from an automotive analysis firm addressed the impending merger between Daimler-Benz AG and the Chrysler Corporation. The economist considered the Daimler-Chrysler merger to be one of the easiest combinations between automotive companies in the current environment. The goal of the merger was not to achieve substantial cost savings but rather to exploit growth opportunities. Daimler-Chrysler is a good fit because there is little direct overlap among their products or in their current markets. This will allow increased market and expansion opportunities as well as future product development possibilities for the new firm. This merger appears to be a win/win situation for both companies, with both sides using their market strengths and expanding into new areas. The newly formed company will place Chrysler in a better position to compete with both General Motors and Ford. Competitive pressures on pricing and profit margins in the vehicle industry are expected to continue, and this merger should allow Chrysler to be more competitive.
Because there are no significant product overlaps, no major layoffs or plant closures are anticipated as a result of the merger. Furthermore, because the merger has no complicated financial or political issues, it should proceed fairly smoothly. However, there are some cultural issues that the economist felt can be resolved.
The economist then discussed whether the Daimler-Chrysler merger was the start of a wave of consolidation within the global automotive industry. Other potential combinations will be more difficult than the Daimler-Chrysler merger. The conclusion reached was that this merger is unique and will not start any merger mania. With further mergers among the major auto manufacturers seen as unlikely, the industry is expected to follow a path toward more collaborations and joint ventures. Politics and regulations will play a deterring role in this process.
Finally, the economist noted that the current light vehicle market is one of stability being supported by a healthy economic expansion in both the U.S. and Canada. The concern for the vehicle manufacturers is that consumers feel that they can postpone the purchase of a new vehicle; if the economy takes a downturn, vehicle sales could fall. However, the strong stock market, good real economic growth, the large number of jobs created, consumer confidence hitting a 30-year high, extremely favorable credit conditions, and real vehicle price declines have all contributed to higher new vehicle sales than most economists expected. The outlook for 1998 is good. No economic slumps should occur, and auto sales should hold their level of around 15 million units. The longer-term outlook for vehicle sales by this economist is for a modest decline to 14.8 million units in 1999.
Manufacturers try to look ahead
An economist from one of the major U.S. manufacturers gave the company’s outlook for the auto industry. This economist looked at two major leading indicators for the auto industry: ability to buy and willingness to buy. The indicators that determine consumers’ ability to buy are disposable income, household debt, inflation, and the interest rate yield curve (subtracting the one-year interest rate from the ten-year interest rate). With the exception of household debt, which caused some possible concern, the other indicators are all very positive. The four indicators that determine consumers’ willingness to buy are consumer attitudes, initial unemployment claims, manufacturing work week, and the stock market. These factors all indicate a willingness by consumers to buy a vehicle. The forecast for vehicle sales by this economist is for 1998 sales of new vehicles in the U.S. to be 15 million to 15.5 million for the fifth straight year.
This economist then turned to the long-run demand for new vehicles, which is determined by the following three factors: change in the number of households, change in the number of vehicles per household, and replacement of scrapped vehicles. Both the number of households and number of vehicles per household have been increasing over time and are expected to have a positive impact on new vehicle sales. As the quality of the existing stock of vehicles continues to grow over time, scrappage rates for vehicles are projected to drop over the next few years. This reduction in scrappage rates will have a negative impact on new vehicle sales. How manufacturers respond to these changes will help determine the direction of new vehicle sales.
The perspective of a manager from a foreign nameplate producer was favorable. This manager felt that the auto market is anemic when looking at month-to-month sales. One-month sales are down, and analysts scramble to explain what has happened; the next month sales boom, and the opposite occurs. “Cautiously optimistic” is the producer’s outlook for light vehicle sales in 1998. The company is optimistic because the economic fundamentals of the market are good. The manager sees two risks on the horizon: increasing consumer debt and the Asian crisis. Consumers are overextended and delinquencies and bankruptcies are at very high levels. While debt levels may not really be a problem now, if the economy slows down, the high debt levels would become a greater concern. At the time of the symposium, the Asian crisis had not had much of an impact on the U.S. economy other than increasing the trade deficit. However, some effects will be felt by the U.S. economy in 1999. The manager was cautious because the business cycle has done so well for so long that one has to wonder how long it can last.
Growth in the light vehicle industry has slowed, and this has caused competition to intensify. Any pent-up demand for light vehicles has been satisfied. Given these conditions, not much growth in this industry is seen over the next several years. As the Asian crisis begins to have a greater effect on the U.S. economy, light vehicle sales are expected to decline slightly over this year and next year with modest growth expected by the year 2000.
As we consider future sales opportunities, manufacturers need to be conscious of demographic changes. Sport utility vehicles are the fastest growing segment in this market. The passenger car market, which has been weak over the past several years, is anticipated to continue to be soft over the next three years. The aging of the baby boomers will represent the largest demographic shift over the next few years and will affect sales accordingly. Manufacturers are adjusting their forecasts and sales efforts to take this into account. Internet marketing strategies were discussed as being a vital component of selling products in the future; currently about three-quarters of this manager’s dealers are hooked up to the Internet.
Dealers cautiously optimistic
Next, a speaker representing vehicle dealers made several observations about the current market. From the dealers’ standpoint, the Daimler-Chrysler merger is a very positive thing. Dealers want manufacturers to grow and be profitable, which this merger certainly should support. Everything was positive for dealer sales in 1997. Real economic growth was near 4%, employment growth was quite positive, the stock market did well, consumer confidence was at a 30-year high, credit conditions were favorable, and vehicle prices were staying flat. Taking this into 1998, conditions are continuing favorably, but at a slower pace. Dealer optimism has been slowing recently, according to the dealer optimism index, but is still very strong. The economic issues that are of concern to dealers are the excess manufacturer capability, lower corporate profits, rising household debt, and the Asian crisis.
It’s not just about cars
An economist from a research company that analyzes the medium and heavy-duty truck industry presented the company’s outlook for this market segment. The economic outlook for trucks was for a continuation of current positive trends. This outlook was based upon strong consumer confidence, low inflation, low interest rates, healthy construction and housing markets, strong capital spending, and improved productivity. A growing economy has an increasing need for shipment of freight and, hence, an increasing need for trucks. The last time the truck industry failed to experience an increase was in the last recession year of 1991.
This is a very special time in the truck industry: Net orders for trucks are at or near record levels, backlogs are nearing record highs, both production and sales could set records this year, cancellation rates are very low, and new and used truck inventories are in line with demand. This industry overall is well positioned to benefit from the economy with no downturn seen any time soon.
The long view
A research economist presented a historical analysis of the geographic distribution of suppliers to the auto industry. Labor force concerns affect locations of suppliers to some degree. As a result, assembly plants are typically located near suppliers, and, based on information about plants and supplier locations, it has been shown that agglomeration definitely exists in the automotive industry.
In the first part of the presentation the economist discussed evidence showing the regional concentration of auto supplier plants. The economist presented the geographic distribution of 820 independent tier 1 supplier plants that opened in the U.S. between 1980 and 1997. These plants are highly concentrated within the so-called auto corridor, a region encompassing southern Michigan and the four states south of it, roughly between the two interstate highways, I-65 and I-75. Within that region, the economist finds highway access to be a very important location factor to assure timely arrival of shipments. In addition, Japanese-owned supplier plants are clustered at the southern end of the auto corridor—close to Japanese-owned assembly plants—while domestic supplier plants are concentrated at the northern end of the corridor in southern Michigan, northern Indiana, and northern Ohio.
In the second part of the presentation, the economist presented evidence on individual assembly plants’ supplier networks. The database used contained just over 3,100 supplier plants that allowed the researcher to investigate how closely supplier plants locate in relation to specific assembly plants. It turned out that for assembly plants located in the automotive corridor, the geographic concentration of supplier networks was remarkably similar, with between 65% and 77% of supplier plants located less than 400 miles away. Assembly plants located at the southern end of the auto region are not able to attract as large a share of their supplier base to be as close. Nissan and especially Saturn, which relies to a large extent on domestic suppliers, have only 45% and 35%, respectively, of their supplier base within 400 miles. Finally, the economist presented some evidence on increasing spatial concentration of supplier networks over time, reporting that between 1970 and 1980 only 17% of Ford’s supplier base was concentrated within 100 miles of Dearborn, Michigan. However, that percentage had increased to 35% for suppliers to Ford that opened plants between 1983 and 1993.
Conclusion
The participants at the fifth annual Auto Outlook Symposium were very optimistic on the forecast for the vehicle industry. In general they view industry sales as stable at the current good rates. Competitive pressures are seen as intense as manufacturers compete in a market that is saturated in many respects. Opportunities still exist in certain market segments and represent an ongoing challenge for manufacturers to recognize and exploit.
Tracking Midwest manufacturing activity
Manufacturing output indexes (1992=100)
| June | Month ago | Year ago | |
|---|---|---|---|
| CFMMI | 125.0 | 126.6 | 121.4 |
| IP | 130.9 | 131.7 | 126.1 |
Motor vehicle production (millions, seasonally adj. annual rate)
| June | Month ago | Year ago | |
|---|---|---|---|
| Cars | 4.8 | 5.6 | 5.7 |
| Light trucks | 5.2 | 6.5 | 5.7 |
Purchasing managers' surveys: net % reporting production growth
| July | Month ago | Year ago | |
|---|---|---|---|
| MW | 52.0 | 56.8 | 59.0 |
| U.S. | 49.2 | 50.7 | 64.4 |
Purchasing managers’ surveys (production index)
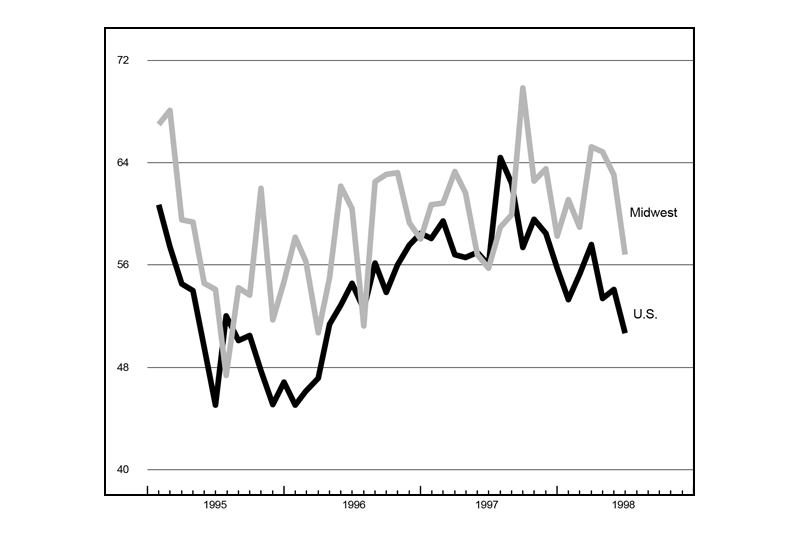
The Midwest purchasing managers’ composite index for production decreased from 56.8% in June to 52% in July. Purchasing managers’ indexes decreased in Detroit and Milwaukee but increased in Chicago. The national purchasing managers’ composite index also decreased from 50.7% in June to 49.2% in July.
The CFMMI decreased 1.2% in June following a revised change of 0% in May. The Federal Reserve Board’s IP index for manufacturing declined 0.8% in June after also having no change from May to June. Total light motor vehicle production decreased to 10 million units in June from 12 million units in May. Light truck production decreased to 5.2 million units in June from 6.5 million units in May, and car production decreased to 4.8 million units from 5.6 million units.


