

The following publication has been lightly reedited for spelling, grammar, and style to provide better searchability and an improved reading experience. No substantive changes impacting the data, analysis, or conclusions have been made. A PDF of the originally published version is available here.
In April and May 2001, a keen competition took place among Chicago, Denver, and Dallas–Ft. Worth following Boeing’s announcement that it would move its headquarters to one of those cities. As revealed by the gusto with which civic leaders in each city competed for the Boeing facility, headquarters operations of large multinationals are a much-valued asset to local economies. Metropolitan areas generally value the presence of headquarters for a number of reasons. They employ a sizable and highly skilled white-collar work force, and they generate demand for numerous specialized business services. This means that the local multiplier effects of headquarters are reported to be large, as corporate headquarters spending percolates through the local economy. So too, headquarters often play a major role when it comes to corporate giving, as well as what is generally referred to as corporate citizen activities.
In this Chicago Fed Letter, we document recent location patterns of headquarters of large corporations among large metro areas of the U.S. and analyze why and how they have changed during the last decade.
Where are headquarters locating?
Headquarters of large corporations have historically gathered in the largest metropolitan areas, especially New York.1 That is not surprising if one considers the nature of headquarters operations. Headquarters employ highly skilled professionals, and they demand ready access to high-level business services such as legal, financial, and advertising. Furthermore, since headquarters facilities must control and administer an often far-flung organization, they require ready access to state-of-the art communication infrastructure, as well as personal transportation—i.e., air transportation and connections. Based on these requirements, a relatively small number of U.S. metropolitan areas enjoy a comparative advantage in hosting headquarters operations.
In order to document recent location patterns of large company headquarters, we analyze Compustat data on all publicly traded companies for the years 1990 and 2000.2 Our analysis applies to headquarters of large companies. These are defined as companies with corporate employment of at least 2,500. We report on changes in headquarters locations for the 20 most populous metropolitan areas (see figure 1).3
1. Largest metro areas by population, 2000
| Metro Areas | 2000 population (thousands) |
1990-2000 growth rate (%) |
| New York, Northern New Jersey, Long Island CMSA | 21,200 | 8 |
| Los Angeles, Riverside, Orange County CMSA | 16,374 | 13 |
| Chicago, Gary, Kenosha CMSA | 9,158 | 11 |
| Washington, Baltimore CMSA | 7,608 | 13 |
| San Francisco, Oakland, San Jose CMSA | 7,039 | 13 |
| Philadelphia, Wilmington, Atlantic City CMSA | 6,188 | 5 |
| Boston, Worcester, Lawrence CMSA | 6,058 | 7 |
| Detroit, Ann Arbor, Flint CMSA | 5,456 | 5 |
| Dallas, Fort Worth CMSA |
5,222 | 29 |
| Houston, Galveston, Brazoria CMSA |
4,670 | 25 |
| Atlanta MSA |
4,112 | 39 |
| Miami, Fort Lauderdale CMSA | 3,876 | 21 |
| Seattle, Tacoma, Bremerton CMSA | 3,555 | 20 |
| Phoenix, Mesa MSA | 3,252 | 45 |
| Minneapolis, St. Paul MSA | 2,969 | 17 |
| Cleveland, Akron CMSA | 2,946 | 3 |
| San Diego MSA | 2,814 | 13 |
| St. Louis MSA | 2,604 | 5 |
| Denver, Boulder, Greeley CMSA | 2,582 | 30 |
| Tampa, St. Petersburg, Clearwater MSA | 2,396 | 16 |
Figure 2 shows the 20 largest metropolitan areas, ranked by the number of large company headquarters. As a group, the largest metro areas were home to 65% of large company headquarters at the beginning and at the end of the most recent decade. However, that overall stability in distribution masks a number of changes. Only three of the top 20 metro areas—New York, Chicago, and San Diego—kept their relative ranking through this period. The New York metro area, which continues to be by far the most important location for large company headquarters in the U.S., on balance added 19 headquarters of large companies during the 1990s. New York maintained its dominance as the major headquarters location by being home to more than twice as many headquarters as the second ranked metro area. Among the biggest “winners” in the 1990s were San Francisco, Houston, and Atlanta, each of which moved up three ranks, gaining 39, 29, and 25 large company headquarters, respectively, during the decade. Conversely, Cleveland, Boston, and Seattle dropped the furthest from their 1990 rank.
2. Headquarters in 20 largest metro areas
| 1990 | 2000 | Gains/Losses | |||
|---|---|---|---|---|---|
| Metro Areas | Total | Rank | Total | Rank | |
| New York | 220 | 1 | 239 | 1 | 19 |
| Chicago | 96 | 2 | 107 | 2 | 11 |
| San Francisco | 52 | 6 | 91 | 3 | 39 |
| Los Angeles | 81 | 3 | 85 | 4 | 4 |
| Dallas | 48 | 7 | 76 | 5 | 28 |
| Philadelphia | 55 | 4 | 70 | 6 | 15 |
| Houston | 41 | 10 | 70 | 7 | 29 |
| Washington, DC | 45 | 9 | 68 | 8 | 23 |
| Boston | 55 | 5 | 66 | 9 | 11 |
| Atlanta | 28 | 13 | 53 | 10 | 25 |
| Minneapolis | 32 | 12 | 50 | 11 | 18 |
| St. Louis | 27 | 14 | 39 | 12 | 12 |
| Cleveland | 46 | 8 | 35 | 13 | -11 |
| Detroit | 32 | 11 | 34 | 14 | 2 |
| Miami | 15 | 16 | 32 | 15 | 17 |
| Denver | 15 | 17 | 26 | 16 | 11 |
| Phoenix | 12 | 18 | 23 | 17 | 11 |
| Tampa | 11 | 19 | 20 | 18 | 9 |
| Seattle | 20 | 15 | 19 | 19 | -1 |
| San Diego | 10 | 20 | 18 | 20 | 8 |
| U.S. share for all 20 | 65% | 65% | |||
Sources: Compustat data and authors’ calculations.
Patterns of change
What explains the change in location pattern among the 20 largest metro areas during the last decade? While the complete answer awaits further analysis, we find that the obvious patterns of change are consistent with those of earlier studies. We first look at differences in the growth of population. As stated above, major population centers are preferred locations for headquarters, especially for those of large companies.4 One might ask how much of the growth variation in headquarters distribution observed during the last decade (see figure 2) can be explained by population growth. We first note that the combined share of U.S. population represented by the 20 largest metro areas remained unchanged at 42.6%. Similarly, the national share of large corporate headquarters represented by the top 20 metro areas remained constant from 1990 to 2000 at 65%. In an age when regions are becoming more closely linked globally, some would argue that the cities that specialize in corporate control and administration have become more specialized, i.e., that globalization might lead to an emergence of a few “corporate control” cities. Subject to our definition of what constitutes a large company, we find no evidence supporting this hypothesis. The share of large company headquarters domiciled in the five largest metro areas actually came down a bit from 1990 to 2000, from 35% to 32%.
Despite the constancy of population share at the top, there have been marked differences in population growth rates among these 20 metro areas (see figure 1).5 Hence, we might hypothesize that the varying headquarters growth experience of the largest metro areas documented in figure 2 might be related to different rates of population growth. Figure 3 explores whether metro areas with large population growth also experienced large growth of headquarters. The correlation coefficient between population and large company headquarters growth is 0.64. This suggests that the variation in population growth “explains” about two-thirds of the variation in the change of headquarters locations during the decade. Of course, in a literal sense, we do not mean that population growth has caused corporate headquarters growth. Most plausibly, market or economic growth has been associated with both population growth and with the success of local companies and their headquarters, which have grown into significant size.
3. Growth rates of population vs. HQs
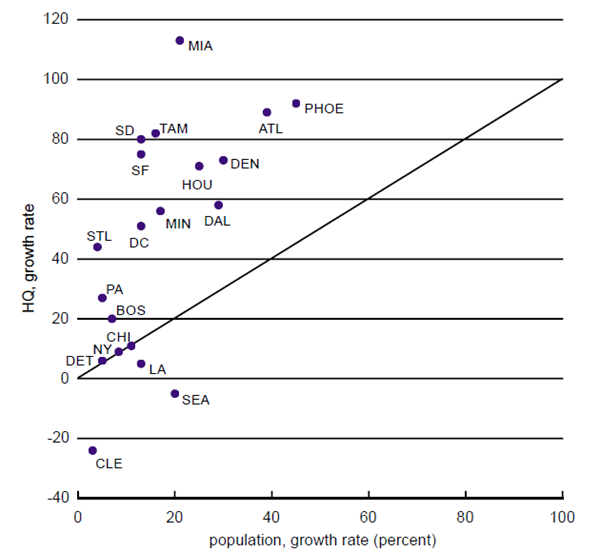
Figure 3 plots the 20 largest metro areas in employment growth/headquarters growth space. Of these 20, 14 metro areas gained headquarters of large corporations at a faster rate than population during the 1990s (shown as points above the 45 degree line). Seattle and Cleveland are outliers, in the sense that they actually lost headquarters during the decade. Three of the four largest metro areas, namely New York, Chicago, and Los Angeles, show increases in population and headquarters that are almost equally proportionate. However, about half of the metro areas show increases in headquarters that are vastly disproportionate to their respective population gains. On closer inspection, there seems to be a pronounced regional effect: None of the headquarters locations that grew more than 60% are in the Midwest or Northeast. This suggests the presence of an industry mix effect explaining some of the variation in headquarters growth.
Companies of large size have historically fallen in the manufacturing sector of the U.S. economy. Manufacturing remains concentrated in the Midwest and Northeast regions. However, over time, manufacturing has come to account for a significantly smaller share of the nation’s large companies and associated corporate headquarters. Hence, manufacturing regions such as the Midwest have been losing headquarters because of their characteristic industry mix. This industry mix effect magnifies the population growth effect that has plagued some midwestern cities with respect to headquarters growth. For example, the Chicago area continues to be a domicile of large manufacturing company headquarters in comparison to other large metropolitan areas (see figure 4). If we perform a hypothetical exercise that purges the Chicago area of its characteristic concentration in manufacturing in 1990, we find that the Chicago region could potentially have attained a total of 128 corporate headquarters by 2000 rather than its actual total of 107.6
4. Chicago’s HQs by industry sector, 2000
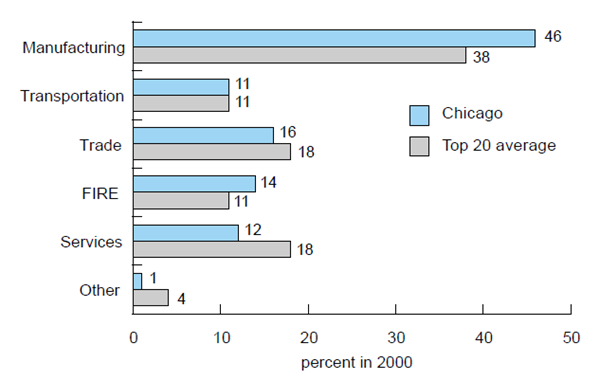
Sources: See figure 2.
While such an exercise is illustrative of the broad industrial forces affecting the distribution of headquarters among metropolitan areas, even a detailed analysis of industry mix does not capture nuances hidden within broad industry classifications such as manufacturing and services. To that end, we take a closer look at two metro areas: Chicago and San Francisco. Both metro areas gained headquarters of large corporations during the last decade: Chicago’s count increased by 13, San Francisco’s went up by 39. In tracing back the headquarters in existence in the year 2000, a noticeably different picture emerges for these two metro areas (see figure 5).
5. History of year 2000 HQs
| Chicago | San Francisco | |
| (------------percent------------) | ||
| Survivors | 50 | 29 |
| Growth | 12 | 31 |
| M&A | 13 | 5 |
| Moves | 7 | 7 |
| New | 14 | 26 |
| Other | 4 | 2 |
Sources: Compustat database, various 10-k filings, and authors’ calculations.
In Chicago, half of all the large company headquarters present in the year 2000 had been in existence in 1990. Meanwhile, Chicago headquarters that emerged as its smaller local companies grew above the 2,500 threshold represent 12% of all headquarters present in the Chicago metro area in the year 2000. In contrast, the San Francisco metro area experienced much more dynamic headquarters growth in the decade. Only one-third of the city’s large headquarters in 2000 were holdovers from 1990, while one-third of headquarters currently located in San Francisco grew into large companies during the last decade. In fact, growth of existing companies combined with newly formed companies—which includes existing private companies going public—represents over half of the current headquarters present in San Francisco.7 In closely examining the industry origins of growth, it appears that San Francisco’s manufacturing sector experienced much more robust growth than was the case in Chicago. The 13 growth companies in Chicago comprised four in manufacturing, three in trade, and three finance, insurance, and real estate sector companies. Three of the four manufacturing companies, telecom equipment maker Tellabs, Methode Electronics, and Littlefuse, represent the high-tech manufacturing sector. In San Francisco’s case, the manufacturing sector (17 companies) and the service sector (eight companies) dominate the metro area’s growth companies (28 overall). At first glance, it may seem surprising that almost two-thirds of the companies that grew to have employment of at least 2,500 in San Francisco during this period are classified as manufacturing. However, San Francisco’s manufacturing and service sector growth companies are almost exclusively linked to the new economy, including, for example, Solectron, Cisco, Adobe Systems, and Symantec.
Conclusion
Large metropolitan areas continue to have a comparative advantage in hosting headquarters of large companies. A detailed analysis of the changing location pattern of publicly traded large companies over the last decade reveals little change in the overall share of large company headquarters domiciled in the 20 largest metro areas. When we examine the considerable growth variation among the largest metro areas, we find that population growth—reflecting a regional shifting of markets—is important in explaining observed changes during this period. In addition, industry mix and geography seem to matter. However, detailed analysis at the level of individual metropolitan areas reveal that corporate headquarters growth also reflects the growth of the indigenous economy, despite all the attention received by the occasional corporate relocation, such as Boeing’s move from Seattle to Chicago. The San Francisco metro area did remarkably well in increasing its tally of corporate headquarters during the 1990s; as the home of Silicon Valley, it garnered most of the growth of companies associated with the new economy. This suggests that policies designed to foster the growth of the economy indigenous to a metropolitan area may also be worth considering in enhancing an area’s attractiveness as a corporate headquarters location.
Notes
1 See Steven R. Holloway and James O. Wheeler, 1991, “Corporate headquarters relocation and changes in metropolitan corporate dominance, 1980–1987,” Economic Geography, Vol. 67, No. 1, pp. 54–74; and Toni Horst and Sophia Koropeckyi, 2000, “Headquarters effect,” Regional Financial Review, February, pp. 16–29.
2 The data represent a panel of all public companies whose shares are traded in the U.S., with the exception of American Depositary Receipts (ADRs), closed-end mutual fund and index shares, and pre-Financial Accounting Standards Board companies. An active company is either a publicly traded company or a company required to file with the Securities Exchange Commission otherwise.
3 We use the most widely defined version of metro areas available, the so-called consolidated metropolitan statistical area (CMSA); thus, the data are not affected by relocations of headquarters from a central city to a suburban location within the same metropolitan area. For example, the Chicago CMSA encompasses the primary metropolitan statistical areas of Chicago, IL, Gary, IN, Kankakee, IL, and Kenosha, WI.
4 Note that in the case of Boeing’s recent decision, its previous headquarters location, Seattle, as well as the three cities it considered moving to, are among the 20 most populous metropolitan areas in the country.
5 Figure 1 lists the largest 20 metro areas as defined by the 2000 census data. However, the identity of the top 20 has hardly changed since 1990. Pittsburgh dropped from rank 18 in 1990 to rank 21 in 2000, and Tampa moved up from rank 21 to rank 19.
6 We impose the national distribution of industry shares on the Chicago economy for 1990. We then allow each industry sector—for example, manufacturing, or services—to grow at the Chicago-specific sectoral rate from 1990 to 2000.
7 Figure 5 also illustrates for both metro areas that headquarters relocations, such as Boeing’s, are rather rare events.


