

With the rise in economic inequality in the United States in recent decades, there has been growing concern about whether there is a sufficient degree of equality of opportunity in our society. Policymakers and researchers alike often focus on studies of intergenerational mobility as a way of assessing opportunity. These studies typically analyze distinct aspects of socioeconomic status, such as income, education, occupational status, and health, and measure the association in these outcomes between parents and their adult children.1 If the association (level of similarity) is very high, then this may indicate that there is low mobility and relatively little opportunity for poor children to overcome their initial economic disadvantage.
However, one important dimension of economic status that has largely been overlooked in these studies is financial health. In particular, the ability to access credit is one critical way in which individuals and families can improve their living standards—for example, by investing in education, housing, or starting a business. Access to credit is also important to help families cushion against financial shocks, such as a job layoff or medical emergency. In this Chicago Fed Letter, we focus on several measures of intergenerational mobility that utilize credit scores.
Credit scores are explicitly designed to measure an individual’s financial health and are used by lenders in determining whether to extend credit. Credit scoring algorithms are proprietary and take into consideration a large number of factors, such as credit payment history, amount of outstanding debt relative to borrowing limits, depth of credit history, and requests for new credit accounts. As a result, they provide a very useful summary measure of financial health. Family characteristics also influence early-career credit health.2 Credit scores, therefore, offer a new and interesting way to study the transmission of economic well-being across generations.
Data sample
For this analysis, we use credit bureau data from 1999 through 2018 from the Federal Reserve Bank of New York’s Consumer Credit Panel/Equifax (CCP) database, a 5% random sample of the population with a credit history. We exploit information on age and shared residential address to create family links, following the methodology of Baum-Snow, Hartley, and Lee (2019).3 Our sample of children includes individuals born between 1964 and 1988, and a “parent” is defined as anybody 16–45 years older than the child and reporting the same address as the child when the child is first observed in the data. We use the Equifax Risk ScoreTM data on parents and children as our credit score measure. We only use scores when individuals are aged 30 or over in order to reduce the well-known biases that arise when comparing people at different stages of their life cycle in the income mobility literature.4 Our final sample consists of 113,046 children linked to parents. Using the mean Equifax Risk ScoreTM for parents and children, we also rank both parents and children within their birth cohorts. We calculate the following four measures of intergenerational mobility: intergenerational credit score association, rank–rank slope, conditional expected ranks, and transition probabilities, which we describe below.
Results
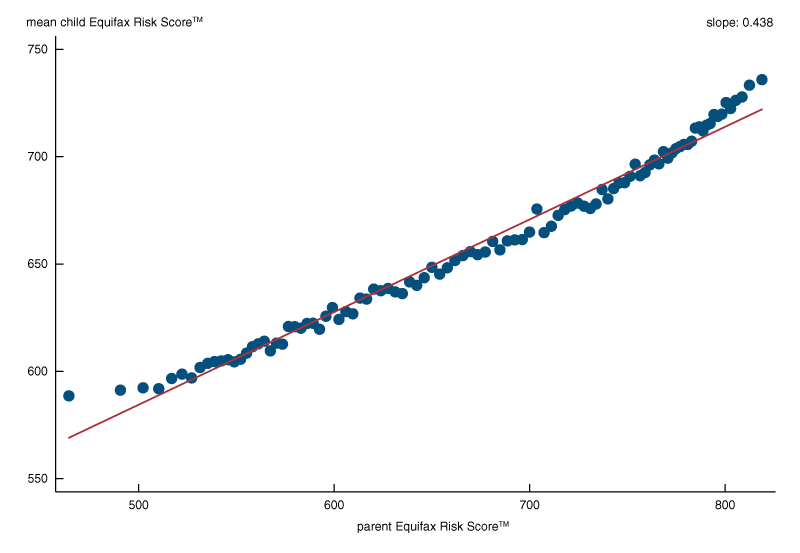
Figure 1 shows a binned scatter plot of mean child risk scores against parent risk scores. The slope of the line through the fitted values is 0.438 and is estimated by regressing the child’s mean Equifax Risk ScoreTM on the comparable measure for parents. This slope coefficient, which we refer to as the intergenerational credit score association (ICA), is analogous to intergenerational income elasticity (IGE), which is probably the most widely used measure of intergenerational income mobility as it captures the rate of intergenerational persistence. For example, suppose we compared children from two different families whose parents’ credit scores differed by 100 points. Our estimate suggests that, on average, we would expect credit scores in the child generation to differ by 44 points. This ICA estimate is actually quite similar to most IGE estimates for the United States, which are typically around 0.5 or higher.5 U.S. levels of intergenerational income persistence are among the highest across all advanced economies,6 suggesting that U.S. intergenerational income mobility is relatively low. Our ICA estimates suggest that mobility with respect to credit scores is similarly low.
1. Mean level of child versus parent Equifax Risk ScoreTM
Our second mobility measure, the rank–rank slope, is a “positional” measure of mobility and has been popularized by the widely cited work of Chetty et al. (2014).7 It is estimated by regressing the percentile rank of the child’s credit score on the percentile rank of the parent’s score. Our estimate of the rank–rank slope is 0.407. This means, on average, a 10 percentile increase in a parent’s rank is associated with an increase of 4 percentiles in their child’s rank in their own generation. Our estimate is comparable to the rank–rank slope in family income, which is estimated at 0.4 (Mazumder, 2016). Figure 2 is a scatter plot of the mean percentile rank of children against their parent’s percentile rank. It illustrates a strong positive relationship that is almost perfectly linear between parents’ and children’s ranks.
2. Mean rank of child versus parent rank

Our third measure is the expected rank of children with parents at the 25th or 75th percentile of the Equifax Risk ScoreTM distribution. These conditional expected rank measures are valuable because they provide a sense of “directional” mobility. In other words, they provide useful information about the degree of upward mobility for a typical family in the bottom of the distribution and downward mobility for a typical family at the top of the distribution. The measures are calculated by taking the mean rank of children whose parents are at the 25th or 75th rank in the risk-score distribution. We find that the expected rank for children whose parents are at the 25th percentile (E[R|P=25]) is the 40th percentile. This means that a typical child whose parents are near the bottom is expected to surpass their parent’s rank by 15 percentiles. This is very similar to the degree of upward mobility in income found by Halliday, Mazumder, and Wong (2018) but a bit lower than Chetty et al.’s (2014) result of an expected child rank in the 45th percentile.
We find that the expected rank for children whose parents are at the 75th percentile (E[R|P=75]) is the 60th percentile. This suggests that the average degree of downward mobility from the top of the distribution is also 15 percentiles. This is identical to what was found by Halliday, Mazumder, and Wong.8
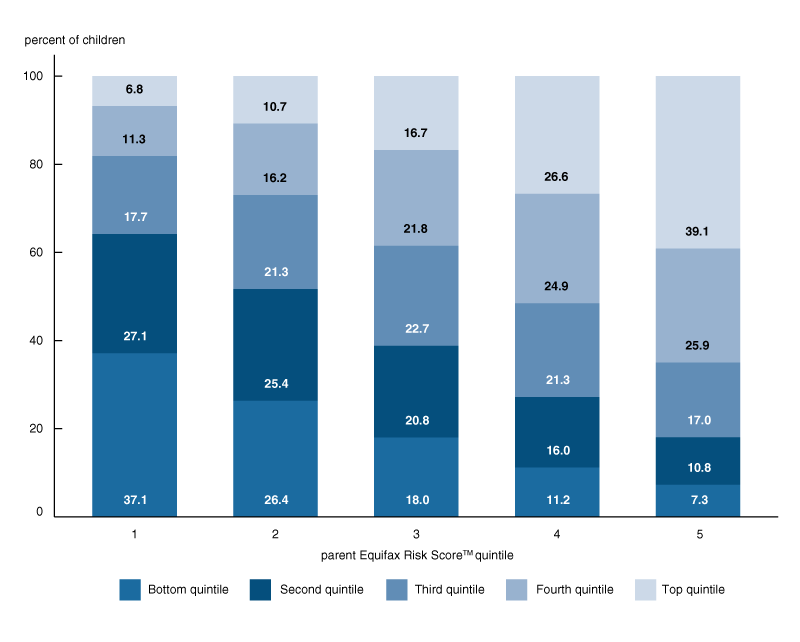
Our final measure, a “transition” matrix, is shown in figure 3. The matrix contains the probabilities of moving from each of the different quintiles in the parent’s credit score distribution to the analogous quintiles in the child generation. This provides a broader set of directional mobility estimates that can also be compared with the results of many previous studies on income mobility. According to our estimates, the probability of a child reaching the top quintile conditional on their parents being in the bottom quintile (TP20, 80) is 7%. The probability of moving from the top to the bottom quintile (TP80, 20) is about the same. These estimates are roughly in line with other estimates of the phenomena called “rags to riches” and “riches to rags,” based on family income. For example, a report by the Pew Economic Mobility project found the rags to riches mobility in income to be 6% and riches to rags to be 9%.9
3. Transition probability matrix
Summary
We present what we believe are the first measures of intergenerational mobility in the United States based on credit scores. Our estimates across a variety of measures suggest that there is quite a strong association between the financial health of parents and their children that is comparable to what researchers find using income data. This suggests that the relatively low rates of intergenerational income mobility that we observe in the U.S. compared with other advanced countries might also apply for financial health and the ability to obtain credit for economic advancement. There is wide scope for further research to better explain the mechanisms underlying this high degree of intergenerational persistence in financial health.
Notes
1 Bhashkar Mazumder, 2018, “Intergenerational mobility in the United States: What we have learned from the PSID,” The ANNALS of the American Academy of Political and Social Science, Vol. 680, No. 1, pp. 213–234. Crossref
2 Sarena Goodman, Alice Henriques, and Alvaro Mezza, 2017, “On intergenerational immobility: Evidence that adult credit health reflects the childhood environment,” Finance and Economics Discussion Series, Board of Governors of the Federal Reserve System, No. 2017-032, revised November 2017. Crossref
3 Nathaniel Baum-Snow, Daniel Hartley, and Kwan Ok Lee, 2019, “The long-run effects of neighborhood change on incumbent families,” Federal Reserve Bank of Chicago, working paper, No. 2019-02, March 18. Crossref
4 Steven Haider and Gary Solon, 2006, “Life-cycle variation in the association between current and lifetime earnings,” American Economic Review, Vol. 96, No. 4, September, pp. 1308–1320. Crossref. Further, we restrict our sample to parent-child pairs where the parents have at least 20 quarters and the children have at least four quarters of Equifax Risk ScoreTM data. This is to avoid measurement error due to transitory factors impacting credit scores.
5 Bhashkar Mazumder, 2016, “Estimating the intergenerational elasticity and rank association in the United States: Overcoming the current limitations of tax data,” in Inequality: Causes and Consequences, Lorenzo Cappellari, Solomon W. Polachek, and Konstantinos Tatsiramos (eds.), Research in Labor Economics, Vol. 43, Bingley, UK: Emerald Group Publishing Limited, pp. 83–129. Crossref
6 Miles Corak, 2013, “Income inequality, equality of opportunity, and intergenerational mobility,” Journal of Economic Perspectives, Vol. 27, No. 3, Summer, pp. 79–102. Crossref
7 Raj Chetty, Nathaniel Hendren, Patrick Kline, and Emmanuel Saez, 2014, “Where is the land of opportunity? The geography of intergenerational mobility in the United States,” Quarterly Journal of Economics, Vol. 129, No. 4, November, pp. 1553–1623. Crossref
8 Timothy Halliday, Bhashkar Mazumder, and Ashley Wong, 2018, “Intergenerational health mobility in the US,” IZA Institute of Labor Economics, discussion paper, No. 11304, January, available online.
9 Julia B. Isaacs, Isabel V. Sawhill, and Ron Haskins, 2008, Getting Ahead or Losing Ground: Economic Mobility in America, Brookings Institution and Economic Mobility Project of the Pew Charitable Trusts, available online.


