

In this article, we examine the recovery from the recession that began with the onset of the Covid-19 pandemic in the U.S. To do so, we present and discuss for the first time the results from a mixed-frequency Bayesian vector autoregressive model called ALEX. This model uses 107 monthly and quarterly indicators of economic activity to forecast the near-term path of U.S. real gross domestic product (GDP).
On June 8, 2020, the National Bureau of Economic Research (NBER) announced that U.S. economic activity had reached a cyclical peak in February 2020, according to its Business Cycle Dating Committee.1 The committee was swayed in its decision to identify the start of a recession given the depth of the decline in economic activity that began in March 2020. Activity started to fall that month as public health orders requiring nonessential businesses to close were implemented during the early stages of the Covid-19 pandemic here in the U.S. The decline in activity accelerated in April as these orders were expanded to cover nearly the entire country. However, as businesses gradually reopened in May and throughout the summer months, U.S. economic activity began to recover.
The first release of U.S. GDP data for the third quarter of 2020 is scheduled to be published by the U.S. Bureau of Economic Analysis (BEA) on October 29, 2020. In anticipation of this official release, we examine forecasts for the near-term recovery in economic activity in this Chicago Fed Letter. Included in these forecasts are results presented for the first time from a mixed-frequency Bayesian vector autoregressive model that we call ALEX, named after our dear departed colleague at the Chicago Fed who was instrumental in its development.2 ALEX uses the information in 107 monthly and quarterly indicators of U.S. economic activity to forecast the near-term path of U.S. real GDP.3
Introducing ALEX
Like the Atlanta Fed’s GDPNow4 and the New York Fed Staff Nowcast5 models, ALEX is an example of the use of “big data” techniques in macroeconomic forecasting. Developed over several years, ALEX is the culmination of a lengthy process of model development and testing.6 ALEX was designed to efficiently process the daily flow of information for the major monthly and quarterly statistical releases that policymakers and private sector analysts follow in order to understand the real-time evolution of U.S. GDP. Many of ALEX’s variables themselves serve as source data used by the BEA in its official GDP calculations.
It is important to note, however, that ALEX is a reduced-form statistical model capturing the historical correlations and dynamics of its data series. It should not be confused with modern structural macroeconometric models, such as dynamic stochastic general equilibrium (DSGE) models. In some cases, these structural models produce vector autoregressive representations like ALEX does, but they embody more than just statistical assumptions about the nature of their data series. Furthermore, ALEX’s forecasts are purely model based. No judgment or economic theory is used to adjust them. Even the priors used to estimate ALEX are data driven, as the hyperparameters are estimated with empirical Bayesian methods and not calibrated with auxiliary data or assumptions.7
Mixed-frequency vector autoregressive models similar to ALEX have been used in the past to forecast both U.S. and regional economic activity with varying degrees of success.8 For instance, a predecessor to ALEX was shown to be equally accurate on average in producing forecasts of U.S. real GDP growth zero to two quarters ahead and more accurate three to four quarters ahead in comparison with surveys of private sector forecasts.9 In order to improve upon these earlier results, ALEX incorporates many additional variables relevant for U.S. GDP that are also used by GDPNow and other models to form more-accurate current-quarter real GDP growth forecasts. Next, we take a closer look at ALEX’s latest predictions.
The third quarter of 2020 and the year ahead
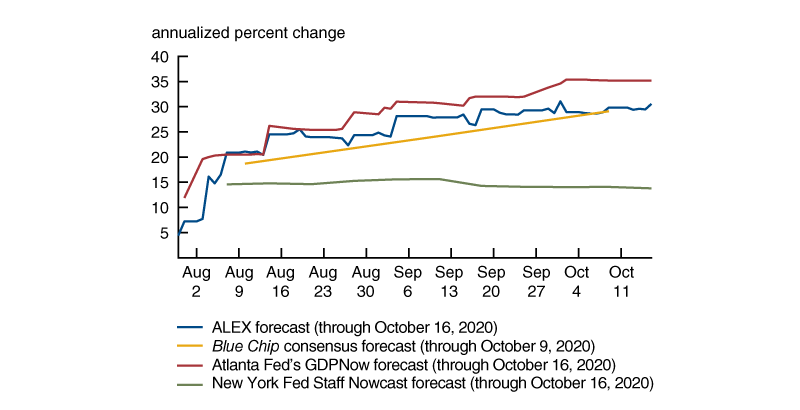
The decline in economic activity brought on by the private sector and public sector responses to the pandemic were very large by historical standards. As seen in figure 1, U.S. real GDP declined on an annualized basis by 5.0% and 31.4% in the first and second quarters of 2020, respectively. Like many other forecast models, however, ALEX translates the incoming data since June into a rebound in real GDP in the third quarter. At 30.8% on an annualized basis using data through October 20, 2020, the recovery in the third quarter projected by ALEX would also be very large by historical standards. Yet, as we will show, it is important to keep in mind that even this substantial improvement does not return real GDP to its pre-pandemic levels.
1. U.S. real gross domestic product growth and forecasts

Sources: Authors’ calculations; and U.S. Bureau of Economic Analysis (BEA), Wolters Kluwer’s Blue Chip Economic Indicators, Federal Reserve Bank of Atlanta, and Federal Reserve Bank of New York data from Haver Analytics.
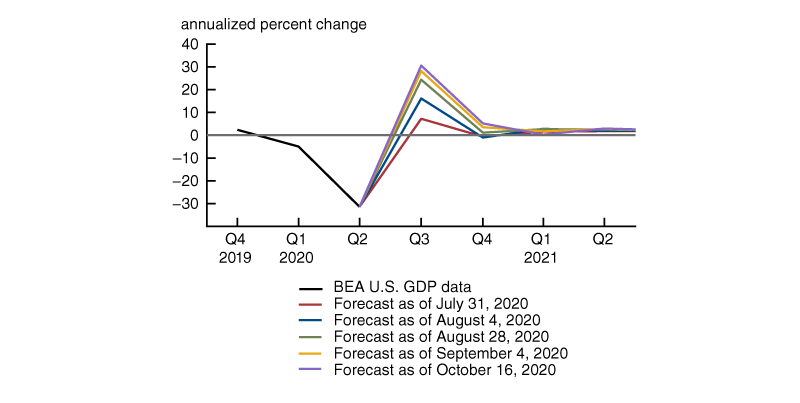
The magnitude of the projected increase in GDP in 2020:Q3 from ALEX is largely in line with the forecasts of other similar models published within the Federal Reserve System, such as GDPNow, and those collected from surveys of private sector forecasters, such as the Blue Chip Economic Indicators consensus forecast (also shown in figure 1).10 Furthermore, as figure 2 demonstrates, nearly all of these forecasts have trended higher over the course of the summer and into the fall as many economic indicators have come in above forecasters’ expectations for them. In particular, labor market and consumer spending indicators have led the way during the initial recovery phase.
2. Evolution of 2020:Q3 real gross domestic product growth forecasts
Sources: Authors’ calculations; and Wolters Kluwer’s Blue Chip Economic Indicators, Federal Reserve Bank of Atlanta, and Federal Reserve Bank of New York data from Haver Analytics.
Figure 3 shows that the incoming data have generally been stronger than expected by ALEX, with the data for June and July personal consumption expenditures (released on July 31 and August 28, 2020, respectively), July vehicle sales (August 4, 2020), August employment (September 4, 2020), and September retail sales (October 16, 2020), in particular, all leading to increases in ALEX’s real GDP growth forecasts for the remainder of 2020. All together, the incoming data through October 20 of this year point to a considerably less weak forecast for real GDP growth in 2020 (–2.7% for 2020:Q4 compared with 2019:Q4), with much stronger annualized forecasts for both 2020:Q3 (30.8%) and 2020:Q4 (5.2%). Yet, notably, this predicted growth for the remainder of 2020 and the first three quarters of 2021 (0.6% for 2021:Q1, 3.1% for 2021:Q2, and 2.3% for 2021:Q3 on an annualized basis) would not be sufficient to return real GDP to its pre-pandemic levels.
3. Evolution of ALEX forecasts for real growth domestic product growth
Sources: Authors’ calculations; and U.S. Bureau of Economic Analysis (BEA) data from Haver Analytics.
Accounting for uncertainty
Like any statistical model, ALEX’s predictions incorporate uncertainty. For instance, what we display in figure 1 represents one possible path, or a point forecast, for real GDP growth. To summarize the degree of uncertainty around this path, we simulate ALEX over 100,000 times in order to account for potential “shocks” to its variables based on the underlying data’s history and statistical uncertainty surrounding the model’s estimation.11 This density forecast is summarized in figure 1 in the shaded coverage intervals (CIs). In essence, the CIs show the range of values in each quarter that ALEX simulates 90% or 70% of the time for U.S. real GDP growth.
ALEX’s forecasts of real GDP growth tend toward a trend rate in the medium run, as seen in figure 1. The priors used to estimate the model contain a fair amount of information about what this rate should be, limiting the degree of uncertainty over time as the model’s forecasts approach this rate. However, the uncertainty in growth rates propagates outward in levels, leading to greater uncertainty over the level of GDP the further ahead the model is used to forecast. This distinction can be seen by comparing figures 1 and 4: The CIs for the level of GDP widen over the forecast horizon (figure 4), whereas those for GDP growth do not widen nearly as much (figure 1).
4. Measures of forecast uncertainty for real gross domestic product

Sources: Authors’ calculations; and U.S. Bureau of Economic Analysis (BEA) and Wolters Kluwer’s Blue Chip Economic Indicators data from Haver Analytics.
Figure 4 is particularly useful when considering the model’s expected path for the U.S. economic recovery over the next year. One can see from the red line in the figure the median, or “middle,” projection of ALEX for the level of real GDP.12 In this case, real GDP is expected to continue to recover over the next year, but not back to pre-pandemic levels by 2021:Q3. Instead, like the Blue Chip consensus forecast, ALEX projects a gradual recovery from 2020:Q4 onward. The coverage intervals then provide context for the amount of uncertainty around this forecast. Both 90% and 70% CIs in the figure include the possibility of GDP returning to pre-pandemic levels by 2021:Q3, but they also include the possibility of negative growth in 2021 (see figure 1). However, only the 90% CI includes the possibility of another substantial decline in GDP in 2021.
Here, it is worth noting that ALEX is a model designed to capture the interconnectedness of various sectors of the U.S. economy and is not a model of just the economic effects of the pandemic period itself. ALEX’s projections are based solely on historical relationships that include the earlier phase of the pandemic, but are not limited to this period given that its sample history extends all the way back to 1973. The amount of uncertainty surrounding ALEX’s forecasts is likely to be higher as a result of the pandemic, such that even the simulation in figure 4 may understate the current level of uncertainty.
For example, the simulation exercise previously discussed treats the shocks to the economy that might happen over the next several months and quarters as independent of each other. This implies, for instance, that while a positive shock to real GDP in the third quarter of this year could lead to a temporary deviation from the model’s forecast, it does not lead to a higher likelihood of a positive shock to real GDP in the fourth quarter. In normal times, this characterization of the model’s forecast errors is appropriate. However, given the nature of this downturn, it is natural to imagine that a positive or negative shock to the economy (e.g., an earlier-than-anticipated vaccine or an unexpected increase in Covid-19 transmissions) might be more persistent, leading to a higher level of uncertainty for the model’s forecasts than what is reported in figure 4.
Yet, interestingly, if you compare the coverage intervals in figure 4 against the range of private sector forecasts for GDP from the Blue Chip Economic Indicators survey (using the reported averages of the top ten and bottom ten forecasts in this case to measure forecaster disagreement), their magnitudes are similar. Like ALEX, the Blue Chip forecasters on average do not expect GDP to return to pre-pandemic levels over the next year, but this possibility is within the upper range of their forecasts, aligning closely with the upper end of our 70% CI in the remainder of 2020 and the upper end of our 90% CI in the first three quarters of 2021. With respect to the lower range, few Blue Chip forecasters expect to see further declines in real GDP through the first three quarters of 2021, with the average of the bottom ten forecasts aligning closely with the lower end of our 70% CI. This suggests that while likely incomplete, our simulation exercise does seem to capture the basic features of the uncertainty about the recovery ahead as expressed by private sector forecasters.
Conclusion
To examine the recovery from the recession that began with the onset of the Covid-19 pandemic here in the U.S., we presented for the first time results from a new mixed-frequency Bayesian vector autoregressive model that we call ALEX. Using the information in 107 monthly and quarterly indicators of U.S. economic activity available as of October 20, 2020, ALEX forecasts U.S. real GDP to increase over the next year, but likely not fully back to its pre-pandemic levels by 2021:Q3. Additional information on ALEX can be found in the accompanying technical appendix.
Notes
2 Alejandro Justiniano, or Alex to many of his friends and colleagues, was a macroeconomist in the Economic Research Department at the Federal Reserve Bank of Chicago. During his tenure at the Chicago Fed, he produced a large body of impressive work, which remains available online.
3 The mixed-frequency Bayesian vector autoregression methodology underlying ALEX is described in Scott A. Brave, R. Andrew Butters, and Alejandro Justiniano, 2019, “Forecasting economic activity with mixed frequency BVARs,” International Journal of Forecasting, Vol. 35, No. 4, October–December, pp. 1692–1707, Crossref. Compared with the model described in that article, ALEX includes more data series and slightly different priors, which better capture the joint evolution of its larger data set. A complete list of variables used in ALEX is available in the accompanying technical appendix.
4 Details for this model are available online.
5 Details for this model are available online.
6 For further background on the development of ALEX, see the discussion about the St. Louis Fed’s 2017 Central Bank Forecasting conference in Francis X. Diebold’s November 26, 2017, No Hesitations blog post.
7 For more information on the priors and their estimation, see the accompanying technical appendix.
8 See, e.g., the models used by CROWE (Center for Research on the Wisconsin Economy) at the University of Wisconsin–Madison to forecast the U.S. and Wisconsin economies, as described on its website, and the Schorfheide–Song model for the U.S. maintained by Dongho Song, of the Johns Hopkins Carey Business School, available online.
9 For example, the predecessor to ALEX discussed in Brave, Butters, and Justiniano (2019) was shown to have a similar real-time forecast performance to that of the Blue Chip Economic Indicators consensus forecast for zero to two quarters ahead and to improve on the accuracy of that consensus forecast by roughly 10% to 15% for three to four quarters ahead—as measured in root mean-squared forecast error over a sample period from 2004:Q3 through 2016:Q1.
10 We use results from the Blue Chip Economic Indicators survey that are collected typically during the first two business days of each month and published by Wolters Kluwer around the tenth of the month. The Blue Chip consensus forecast represents an average of the survey responses.
11 The simulation exercise addresses three forms of uncertainty: parameter, state, and shock uncertainty. Parameter uncertainty concerns the estimation of the model’s coefficients on past values of its variables. State uncertainty addresses the mixed-frequency nature of the model, incorporating the fact that for quarterly variables we do not directly observe their monthly evolution and must infer it from the model. Shock uncertainty simply deals with the stochastic nature of the model and the way we draw shocks from the model’s implied Normal distributions to simulate over the forecast horizon events that are not captured by the model’s historical dynamics.
12 The mean and median projections of ALEX are nearly identical given its approximately normally distributed data. The same is true for its point forecasts for real GDP growth shown in figure 1 and the median forecasts for the level of real GDP shown in figure 4 (when the level is expressed as an annualized percent change).


