In June 2022, the 12-month inflation rate of the U.S. Consumer Price Index (CPI) hit 9.1%, its highest level in over 40 years. The U.S. is not alone: Across the industrialized world, inflation is accelerating during the recovery from the pandemic recession. Although inflation is surging globally, the sources of inflation are different in each country. In this Chicago Fed Letter, we document four facts about where the U.S. stands amid the global inflation surge:
- Inflation has accelerated across industrialized countries, and the U.S. is in the middle of the pack.
- Food and energy prices play the largest role in European inflation acceleration, but play a smaller role in the U.S.
- In the U.S., durable goods prices play an outsized role in overall inflation relative to other countries.
- Labor market conditions and fiscal stimulus are correlated with inflation acceleration across countries.
To illustrate these facts, we analyze data from the Organisation for Economic Co-operation and Development (OECD) in a series of figures.1 The OECD provides data for all 38 member countries and ten selected non-OECD countries, including Brazil, China, Indonesia, and South Africa. Because of limited data availability, not all countries are included in each of the figures. Countries are referred to by their International Organization for Standardization (ISO) country codes. Overall, the acceleration of U.S. inflation is unique due to the large impact of core (nonfood, non-energy) goods, strong durable goods demand, and high fiscal stimulus.2
Inflation has accelerated across countries, and the U.S. is in the middle of the pack
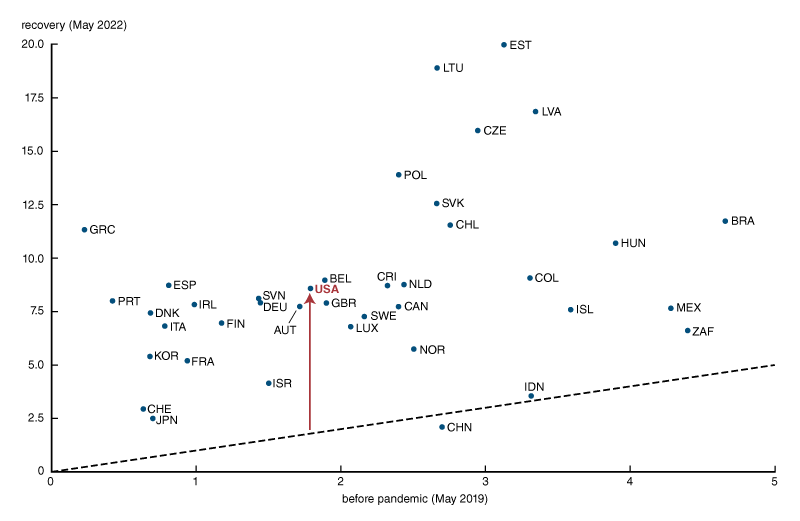
Earlier in the pandemic, the U.S. was notable for its large increase in inflation compared to other countries. Today, other advanced economies are experiencing similar inflation increases. This can be seen in figure 1, which compares the 12-month CPI inflation rate from before Covid-19 (May 2019) to the most recent value available (May 2022) in each country.
1. Inflation in industrialized economies, pre- and post-pandemic
Source: Organisation for Economic Co-operation and Development (OECD).
In figure 1, all countries above the dashed 45-degree line have higher inflation today than they did in 2019, before the pandemic. Except for China (CHN), all countries in the OECD data have seen an increase in inflation. Notice that, both in terms of the current inflation rate (the value on the vertical axis) and the acceleration of inflation (the size of the red arrow), the U.S. is in the middle of the pack of OECD countries.3
Food and energy prices play the largest role in European inflation acceleration, but play a smaller role in the U.S.
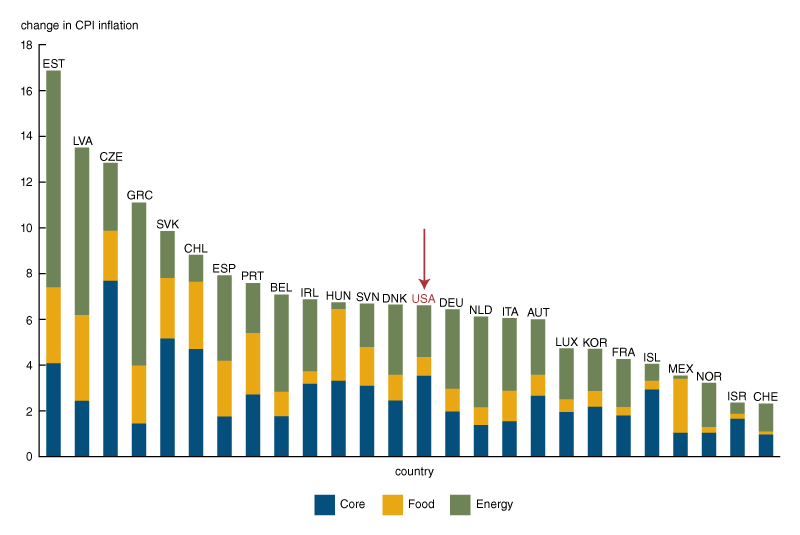
We decompose the acceleration of total CPI inflation from May 2019 to May 2022 by country into contributions from food, energy, and core items. Not all countries in the OECD data set provide data on these subcategories. Figure 2 orders the countries with available data from largest to smallest inflation acceleration. The U.S., which is almost in the middle, is highlighted by the red arrow. It is clear from the size of the bars for food (orange) and energy (green) relative to the bar for core items (blue) that food and energy make up the bulk of the acceleration in inflation in most countries. In 20 out of 26 countries, food and energy together account for more than 50% of inflation acceleration. Thus, commodity prices play a very large role in the international run-up of inflation.
2. Contributions of core, food, and energy to CPI inflation acceleration
Source: Authors’ calculations based on OECD data.
Unlike many European countries, the U.S. is notable in that core items are responsible for more than half of its inflation acceleration, while food and energy play a comparatively minor role. Commodities, such as food and oil, are frequently priced in U.S. dollars. Due to the recent depreciation of most global currencies against the dollar, these countries face greater commodity price pressures than the U.S. Further, the impact of energy on inflation acceleration varies across the sample due to differences in energy intensity. That is, a country that consumes more energy as a share of its total household spending will experience a greater impact of energy prices on its inflation rate.
In the U.S., durable goods prices play an outsized role in overall inflation relative to other countries
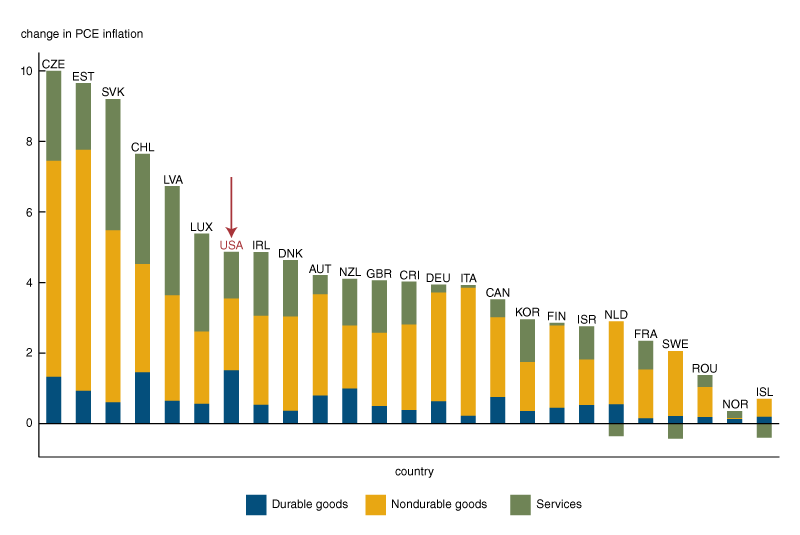
The inflation of durable goods, such as cars and home appliances, has accelerated substantially in the U.S. since the start of the recovery. This helps to explain the greater influence of core items on total U.S. inflation acceleration. Durables had a larger inflation contribution in the U.S. than in any other country in the OECD data set for which the relevant data are available. This is evident in figure 3, which decomposes the acceleration of personal consumption expenditures (PCE) inflation from 2019:Q1 to 2022:Q1 into contributions from durable goods, nondurable goods, and services.
3. Acceleration of PCE inflation by goods type and services
Source: Authors’ calculations based on OECD data.
The outsized contribution of durable goods inflation in the U.S. reflects strong durables demand throughout the pandemic and recovery. Spending on durable goods recovered rapidly after the start of the pandemic, even exceeding the pre-pandemic trend. In the first quarter of 2022, real U.S. spending on durable goods was 7.5% higher than expected based on the pre-Covid trend. Demand for durable goods surged despite rising prices, as the prices of durable goods rose 11% in the U.S. relative to a year earlier.
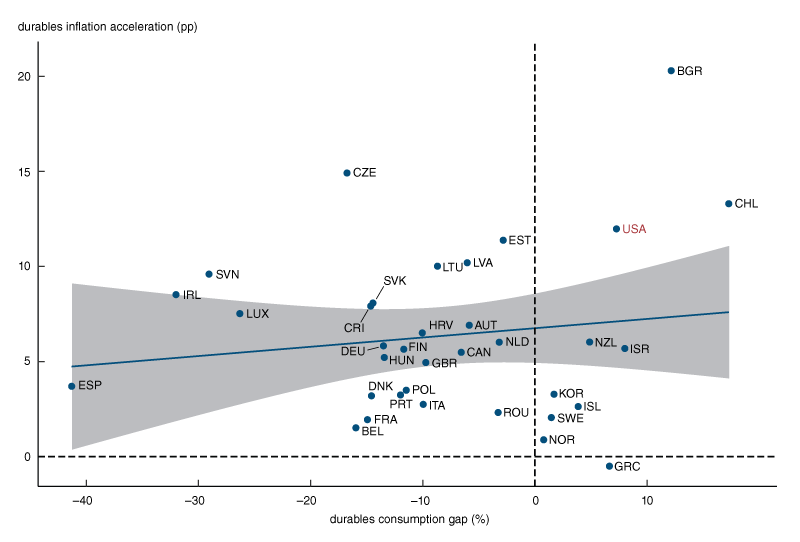
This strength in U.S. durable goods demand during the pandemic and recovery is unusual. Consumers typically delay spending on durable goods during recessions, choosing to keep their old car or kitchen appliances when money is tight. Throughout most countries in the sample, consumers behaved as we would expect, cutting their spending on durable goods. Figure 4 depicts the relationship between the inflation acceleration for durable goods and the durables consumption gap, which is the percentage deviation between actual durables consumption and the pre-Covid trend. Indeed, figure 4 shows that the U.S. is one of just ten countries in which the demand for durable goods is above its pre-Covid trend. Counterintuitively, despite weak demand for durables in most of the sample (on the negative side of the horizontal axis), durable goods inflation has accelerated in all countries but Greece.
4. Durables gaps versus increases in durable goods inflation by country
Source: Authors’ calculations based on OECD data.
The high tradability of durable goods presents a possible solution to this puzzle. Because durable goods can be easily transported and traded between countries, their prices in different countries tend to move together. Strong durables demand in the U.S. can thus push up durable goods inflation everywhere, even in countries where demand is weak. This effect is strengthened due to the size of the U.S. economy, which makes up about 23% of the world economy. The aforementioned 7.5% increase in U.S. durables demand relative to its pre-pandemic trend amounts to an approximate 2% to 3% increase in the global demand for durables.
Labor market conditions and fiscal stimulus are correlated with inflation acceleration across countries
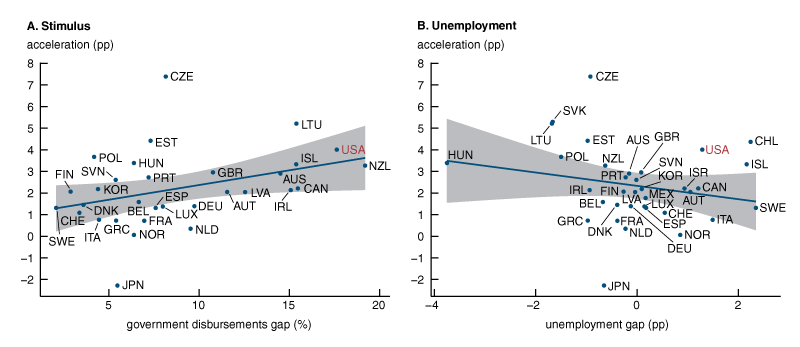
We explore two additional stories behind the variation in inflation acceleration across countries: fiscal stimulus and labor market conditions. Governments around the world responded to the coronavirus public health crisis by enacting fiscal stimulus packages to soften the economic blow from the pandemic. We measure the magnitude of fiscal stimulus by the government disbursements gap: the percentage difference between observed levels of government spending and transfers (excluding interest payments) in 2021 and pre-pandemic OECD forecasts. In panel A of figure 5, we plot the relationship between core inflation acceleration and fiscal stimulus. We see that countries with larger stimulus packages tended to experience greater inflation acceleration. Out of all countries that provide the relevant data, the U.S. enacted the second-largest fiscal stimulus with a disbursements gap of 17.6%, indicating that government spending and transfers increased sharply relative to pre-pandemic trends. This large fiscal stimulus may have driven the surge in U.S. durables demand.
5. Core inflation acceleration and its potential drivers
Source: Authors’ calculations based on OECD data.
The behavior of labor markets during the pandemic has also impacted global inflation. In panel B of figure 5, we plot core inflation acceleration against the unemployment gap, or the difference between observed unemployment rates and pre-pandemic OECD forecasts for the 2021 natural rate of unemployment in each country. A positive unemployment gap implies that a country’s labor market has yet to recover from the pandemic recession. Across countries, the size of the inflation acceleration is negatively correlated with the unemployment gap, suggesting that differences in labor market slack account for a significant part of the cross-country variation in inflation acceleration. Panel B also reveals that the acceleration of inflation in the U.S. is much higher than in other countries with similarly small but positive unemployment gaps. This suggests that, besides labor market conditions, other factors are also important in explaining the increase in inflation in the U.S.
Conclusion
During the recovery from the pandemic, most industrialized economies have experienced substantial increases in inflation. We find that food and energy accounted for a smaller share of inflation acceleration in the U.S. than in the rest of the OECD data set. Strong U.S. demand for durable goods has driven its inflation acceleration, while also pushing up durable goods prices worldwide. Further, larger fiscal stimulus packages and tighter labor markets are associated with greater inflation acceleration across countries.
We have left two areas for future work. First, variation in the stance of monetary policy might contribute to inflation acceleration across countries. Most countries maintained low interest rates during the sample period, making it difficult to explore this variation straightforwardly. Second, variation in the disruption of supply chains might impact inflation acceleration across countries. Additional work assessing the relative importance of each of these factors for inflation acceleration in the U.S. can inform policy efforts to contain inflation going forward.
Notes
1 All code and data needed to reproduce the figures in this Chicago Fed Letter are available for download in .zip format.
2 We leave the role of monetary policy stance and supply chain disruptions for future analysis.
3 This result is robust when we examine the core CPI inflation rates or the personal consumption expenditures (PCE) inflation rates.


