Every month, typically on the first Friday, the U.S. Bureau of Labor Statistics (BLS) releases its Employment Situation Summary. In this monthly report, the very first number is the number of net jobs added or lost since the previous month. Commentators often label it as "strong" or "weak." But is a monthly gain of 10,000 jobs necessarily weak? Or is a monthly gain of 200,000 jobs necessarily strong? A common way to formalize such judgments is to compare the monthly payroll gain against a "breakeven" estimate—i.e., the number of jobs the economy needs to add every month to keep the unemployment rate stable, given factors such as how the working-age population and the labor force participation rate are changing. Observed payroll gains above this benchmark point to a tightening labor market, while gains below it point to a loosening one. For instance, recent work from the Dallas Fed (Cheremukhin, 2025; and Cheremukhin et al., 2026) argues that the breakeven number has fallen from above 200,000 during its peak in the 2022–24 period and that the more modest payroll gains of fewer than 50,000 a month over the second half of 2025, as reported by the BLS, were therefore consistent with a balanced—rather than a weak—labor market.
In this article, we assess the implications of different working-age population growth estimates for our (Chicago Fed) breakeven estimates, or “breakevens” for short. To calculate these numbers we combine in-house models of the long-term trend in labor force participation (trend LFP), the natural rate of unemployment, and an adjustment component that accounts for differences between two key BLS measures of employment, plus an input from outside the Chicago Fed—namely, a forecast of the working-age population. We show that in normal times, the population input is a very stable ingredient of the breakeven calculation. But beginning in 2020, it stopped being so. Here we focus on the years 2022–24, during the post-pandemic immigration surge. Uncertainty about the size of the working-age population increased substantially. As a result, real-time readings of how “hot” the labor market was running, when filtered through the breakeven lens, were overstated relative to what subsequent revisions to working-age population growth implied.
The breakeven jobs number
The breakeven payroll number is the answer to a deceptively simple question: How many jobs does the U.S. economy need to add in a given month to keep the unemployment rate aligned with the Federal Reserve’s goal of maximum employment? The answer has four moving parts. The first part is the working-age population: the civilian noninstitutionalized population age 16 and over (CNIP 16+). As the working-age population grows over time, it expands the supply of potential workers. The second part is the long-term trend in the share of that population willing and able to work: the trend labor force participation rate (LFP*). This trend rate evolves as the demographic composition of the working-age population changes; e.g., as the peak of the baby boom generation has moved from prime working ages toward retirement, the trend labor force participation rate has declined. The third part is the natural rate of unemployment (u*).1 This rate also moves slowly as demographics change because, e.g., young people who are searching for the right career or the right employer have higher unemployment rates than older, more settled, people. The fourth and final part is an adjustment that reconciles employment measures from the two main labor market surveys—namely, the payroll and household surveys from the BLS.2 Combining these elements3 yields the long-term trend level of payrolls: the level of employment consistent with a stable labor market, represented by the following equation:
The month-over-month change in that level is the breakeven number. The logic is straightforward. In a given month, if the change in the number of jobs reported in the payroll survey exceeds this breakeven, the labor market is tightening and, all else being equal, the unemployment rate should be falling4 because the net increase in employment was larger than what would be needed to keep pace with labor force growth. If the realized payroll gain falls below the breakeven, the labor market is loosening. Tracked over time, the breakeven offers a useful benchmark for interpreting the monthly jobs number. Figure 1 plots realized payroll growth against our estimate of the breakevens5 over the past four decades; the gap between the (red) line and the (blue) bars is a gauge of a tight or loose labor market. The vertical gray bars indicate recessions; during these periods, the payroll gains are below the breakevens. During the recovery from the Covid pandemic recession (which occurred in 2020:Q1–Q2),6 payroll gains exceeded breakevens by a large margin compared with what occurred in the rest of the time periods shown. In 2025, payroll gains were below breakevens; in the most recent data (from 2026:Q2), payroll gains have been above breakevens.
1. Comparison of observed and breakeven payroll estimates
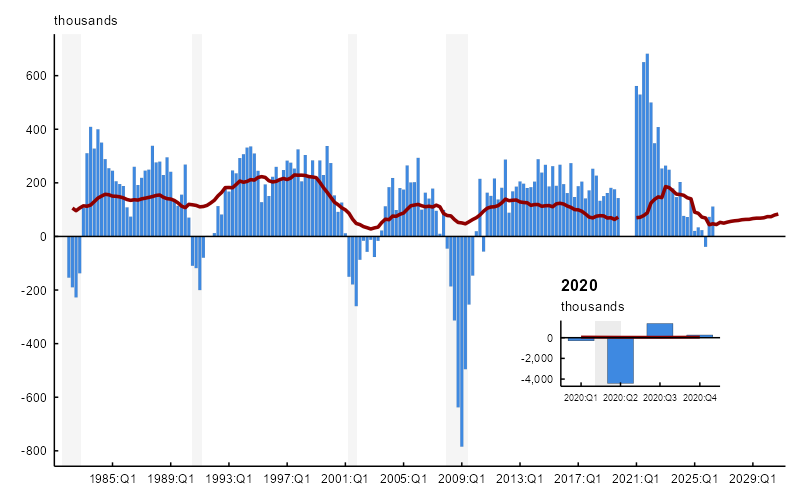
Sources: Chicago Fed staff’s calculations; and authors’ calculations based on data from the U.S. Bureau of Labor Statistics from Haver Analytics.
Of the four inputs that go into the breakeven calculation, u*, LFP*, and the payroll-to-household-survey adjustment are estimated inside the Chicago Fed from models based on Current Population Survey (CPS) microdata, which we update on a regular basis. We use the working-age population estimates provided by external sources—historically, the U.S. Census Bureau’s population estimates and, more recently, the Congressional Budget Office’s (CBO).
Population forecasts are usually unremarkable
Most years, the U.S. Census Bureau publishes a new “vintage” of population estimates, building on the most recent decennial U.S. Census year (currently 2020) by adding births, subtracting deaths, and adding net international migration.7 For most of the post-1970s period, the breakeven calculation has been quite robust to which population vintage we use. The CBO also produces population projections (typically updated every year). Successive vintages typically produce small revisions to the previous year’s working-age population. For example, the average year-to-year revision for U.S. Census Bureau vintages between 2011 and 2018 was 270,000 people, or about 0.1%, according to our analysis. For population projections for a year from the time they are made, average revisions are similarly small. The average one-year-out projection revision for U.S. Census Bureau vintages between 2011 and 2018 was 380,000 people, or just about 0.15%. As a result, the implied breakeven moves only marginally when a new vintage arrives, and assessments of the state of the labor market change little.
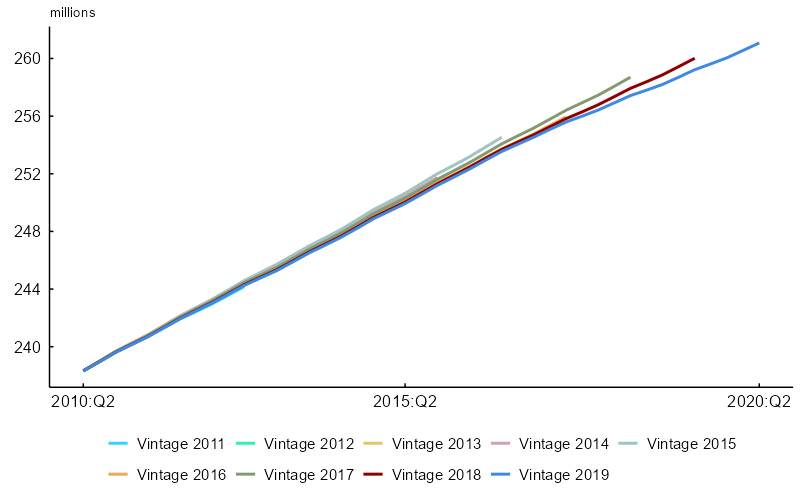
Figure 2 illustrates this. In panel A of figure 2, we overlay CNIP 16+ levels from a sequence of previous U.S. Census Bureau vintages that were, at the time, the most current estimates. Over most of the sample—throughout the 2010s—vintages and their updates are very similar; revisions move the population path by amounts that are small relative to the year-to-year changes in the labor market itself. However, as shown in panel B of figure 2, the last five years (including the 2022 and 2026 CBO trends) tell a different story, which we discuss in the next section.
2. Estimates of the civilian noninstitutionalized population age 16 and older across vintages
A. 2010:Q2–2020:Q2
B. 2020:Q2–2025:Q4
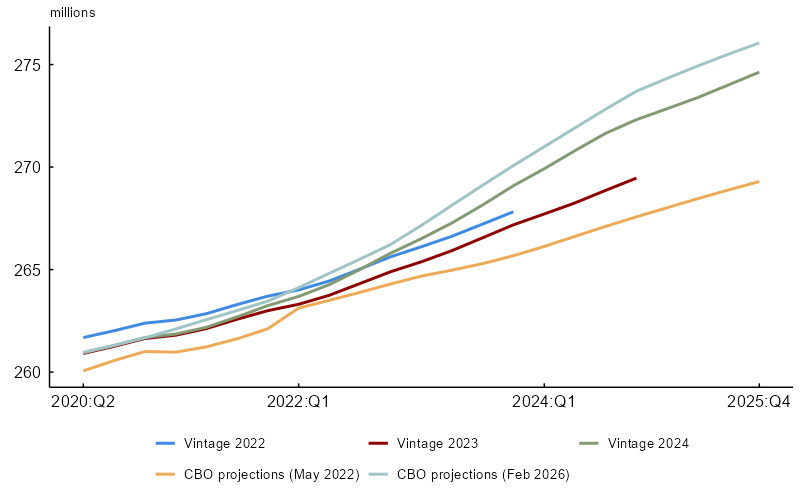
Sources: U.S. Census Bureau and the Congressional Budget Office.
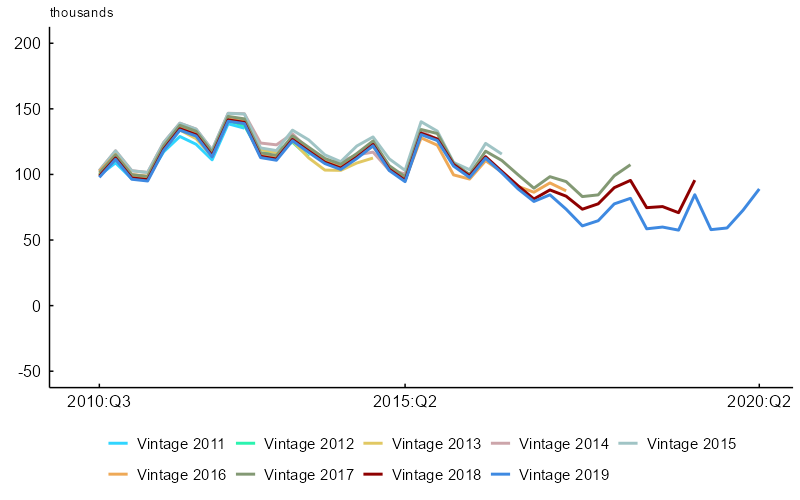
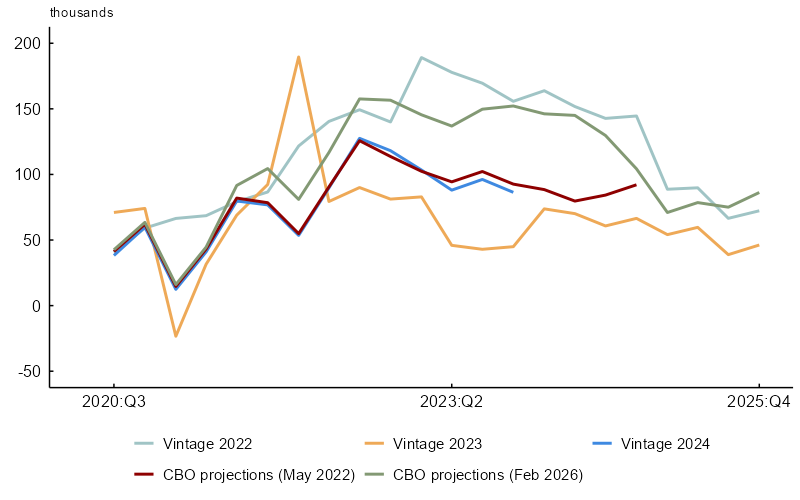
Figure 3 translates the same exercise into the implied breakeven number of jobs for a select subset of historical periods. In panel A of figure 3, the pre-2020 pattern is similar across U.S Census Bureau vintages. Stances on the labor market based on the breakeven concept did not depend much on which vintage’s population estimate was used in any given quarter.
3. Breakeven payroll estimates across vintages
A. 2010:Q3–2020:Q2
B. 2020:Q3–2025:Q4
Sources: Chicago Fed staff’s calculations.
The post-pandemic era
Panel B of figure 2 looks very different from the rest of the sample. From 2021 onward, the population vintages fan out. Each new vintage revised the post-2020 population path upward compared with its predecessor, as the statistical agencies updated their views on the impact of the unprecedented immigration inflows. Although the U.S. Census Bureau and the CBO updated their methodologies in response to the situation on the ground, the real-time information was noisy and fast-changing so that each successive forecast kept being revised upward.
Net international migration to the United States rose sharply in 2022 and remained elevated through mid-2024 (see Butcher and García-Jimeno, 2025). The U.S. Census Bureau’s Vintage 2022, released in December 2022 and reflecting new international migration estimates through the end of June of that year, showed a relatively modest uptick.8 Vintage 2023 revised that upward. Vintage 2024 revised it upward again. For example, while Vintage 2023 expected a 268 million working-age population by early 2024, Vintage 2024 raised the estimate to 270 million. The CBO's February 2026 projections raised it even more, to 271 million. Relative to Vintage 2024 from the U.S. Census Bureau, those February 2026 projections from the CBO revised up the estimated population path from 2024 onward by about 2 million.
Tracking large changes in the population due to changes in net international migration flows is challenging. While births and deaths are well measured from administrative records, net international migration requires combining administrative records, survey data, noisy signals about border activity, and modeling assumptions. Both immigration inflows, especially their irregular component, and emigration outflows, especially those that are voluntary, are hard to measure.
Naturally, high net international migration passes through to the breakeven mechanically. Higher population growth means more workers to absorb each month. Thus, the economy needs a higher monthly payroll gain to keep the unemployment rate unchanged. Panel B of figure 3 shows the implied breakeven under Vintage 2022 running well below the implied breakeven under Vintage 2024 in the years where the two overlap, with both running below the path implied by the CBO’s February 2026 projections. The differences are economically meaningful: At the peak of the discrepancy, alternative vintages produce breakeven estimates that differ by up to 66,000 jobs per month—around 60% of the mean monthly jobs gains over the post-pandemic period, according to our analysis. This highlights how sensitive the breakeven gauge is to uncertainty in the population estimates. While this is typically not a problem, the post-pandemic era turned out to be an exception.
We should emphasize that this was not a failure of the breakeven concept as a framework for evaluating the state of the labor market. It was also not a failure of any of the agencies producing population estimates. The U.S. Census Bureau and CBO each updated their population estimates (plus their estimation methodologies) as new data arrived—see, e.g., notes 7 and 8 and Congressional Budget Office (2024, in particular appendix B). The episode that we’ve focused on was instead a reminder that population growth—one of the breakeven’s key inputs—is a forecast and that forecasts can carry unusual uncertainty when an underlying flow, in this case immigration, moves sharply outside its typical range.
Real-time versus ex-post readings of the labor market
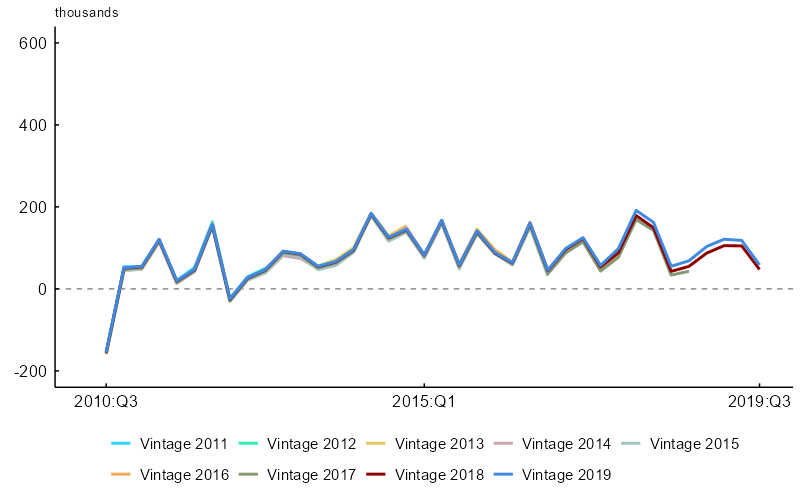
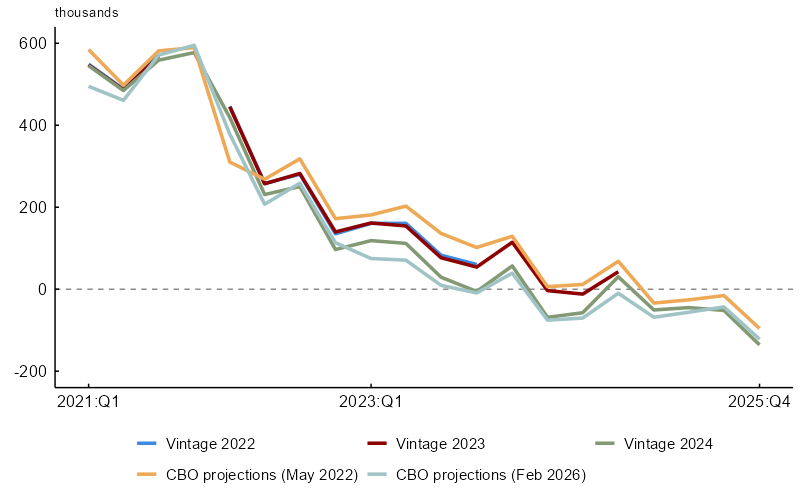
What did this mean for how the labor market came across to analysts through 2022 and 2023? To answer that question, we recompute our breakeven using only the population data that would have been available in real time at each quarter (a real-time vintage view) and compare the resulting observed-minus-breakeven gap to the gap implied by the CBO's most recent (February 2026) projection applied retrospectively (the ex-post view).9 Figure 4 graphs lines representing this gap along with a horizontal dashed line at zero: Positive values indicate that the realized payroll growth exceeded the breakeven associated with that vintage of the population estimate.
4. Gap between realized payroll estimates and breakeven estimates across vintages
A. 2010:Q3–2019:Q3
B. 2021:Q1–2025:Q4
Sources: Chicago Fed staff's calculations; and authors’ calculations based on data from the U.S. Bureau of Labor Statistics from Haver Analytics.
As panel A of figure 4 illustrates, for most of the sample, the different gap lines sit on top of each other: In normal times, switching population vintages moves the breakeven very little. Through the 2010s, the real-time gap and the ex-post gap tell a similar story about whether the labor market was strengthening or weakening in any given quarter.
From early 2022 onward, the lines separate as panel B of figure 4 shows. The real-time gap line using Vintage 2023 (yellow), for instance, shows observed payroll gains running well above the breakeven for most of 2022 and 2023 suggesting a "running very hot" labor market. The ex-post line for the same period, computed with CBO’s 2026 population path (teal), still shows a relatively hot labor market, but by a smaller margin.10 Real-time readings of the labor market, when filtered through the breakeven gauge, overstated how hot the labor market was relative to what subsequent revisions to population turned out to imply.
We are not arguing the labor market was not tight in 2022 and 2023. Wage growth, job vacancies, quit rates, and other labor market indicators all pointed in that direction. Our point, rather, is that realized payroll growth relative to the breakeven as a signal of the change in the state of the labor market can be quite misleading in environments with high population growth uncertainty. And indeed, its informativeness is closely tied to the accuracy of its population forecast input.
Panel B of figure 4 also shows that by the second half of 2024, the gap lines converge again. Once the immigration surge subsided and the U.S. Census Bureau and CBO had incorporated several years of the immigration surge into their estimates, the real-time and ex-post breakevens move closer together, and the gap between realized payroll growth and the breakeven becomes essentially the same under both views.11
Breakeven estimates are uncertain when population change is uncertain
The breakeven payroll estimate remains a useful tool for interpreting the BLS monthly jobs report. Outside of unusual demographic episodes, this estimate depends only weakly on the choice of population vintage, and the labor market signal it produces is robust to that choice. The post-pandemic immigration surge was an unprecedented demographic shock. For the better part of the three years the surge lasted (2022–24), this thermometer inherited the elevated uncertainty in real-time population estimates, and it indicated a tighter labor market in 2022–23 than the data we have today support. A takeaway from the post-pandemic experience, thus, is the importance of attaching wider uncertainty bands to assessments based on the breakeven gauge in periods of hard-to-measure-in-real-time population change.
Notes
1 The natural rate of unemployment (which is sometimes referred to as the long-run neutral rate of unemployment) is the unemployment rate that would prevail in an economy making full use of its productive resources without generating inflationary pressures or, put differently, the rate that would be experienced over the longer run in the absence of shocks to the economy. The unemployment rate is made up of cyclical, structural, and frictional components. The natural rate of unemployment represents the portion that is unemployed for structural or frictional reasons (Rissman, 1986).
2 The formal name of the payroll (or establishment) survey is the Current Employment Statistics (CES) survey. and the formal name of the household survey is the Current Population Survey (CPS). Both surveys from the BLS provide monthly employment measures, though they are different. The payroll-to-household-survey adjustment accounts for the persistent gap between the household survey concept of employment (which includes the unincorporated self-employed among its total employed, but only counts once people who are multiple-job-holders, while also including some categories of workers excluded from payroll counts, such as workers on unpaid leave) and the payroll survey concept that underlies the monthly nonfarm payroll number. Further details on both surveys and their different concepts of employment are available online from the BLS.
3 Three of the four elements—namely, trend labor force participation (LFP*), the natural rate of unemployment (u*), and the payroll-to-household-survey adjustment—are estimated using internal Chicago Fed models.
4 The Chicago Fed model of the natural rate of unemployment has u* falling slowly because population change over time has been shifting the composition of the workforce toward demographic groups with lower frictional unemployment rates (see also note 1). So, more precisely, when the realized payroll number exceeds the breakeven number of jobs, we expect the realized unemployment rate to fall faster than u* (all else being equal).
5 Research into the breakevens for 2026 (and beyond) is ongoing. We expect changes to elements of that calculation beyond the working-age population—such as the trend labor force participation forecast—when the U.S. Census Bureau releases new demographic forecasts. Here, we only focus on the working-age population component.
6 According to the National Bureau of Economic Research’s (NBER) Business Cycle Dating Committee, the Covid pandemic recession began in February 2020. The recession’s trough, when the unemployment rate reached its peak and began to fall, was in April 2020.
7 For a description of the U.S. Census Bureau’s methodology for estimating net international migration, see U.S. Census Bureau (2024).
8 Prior to 2023 the U.S. Census Bureau’s main source of information on net international migration was the most recent vintages of the Americal Community Survey (ACS) and its question on residence one year ago (ROYA). The ACS collects data throughout the year, so in a year when immigration is rising quickly, the ROYA number will be an undercount of all the people who end up entering from abroad in that year. The pandemic led the U.S. Census Bureau to blend in additional official sources: namely, “visa issuances, new student enrollments, refugee admissions, and humanitarian migrant cases from the Bureau of Consular Affairs, Institute of International Education, Refugee Processing Center, U.S. Citizenship and Immigration Services, and Department of Justice” (U.S. Census Bureau, 2022). But the nature of the exercise remained essentially backward-looking. See U.S. Census Bureau (2022, 2024) for the updated methodology for estimating net international migration.
9 In a similar spirit, Orphanides and van Norden (2002) began a strand of academic literature on the reliability of output gap estimates as guides to monetary policy, pointing out that real-time measures of the output gap are prone to considerable mismeasurement.
10 For example, the difference between the breakevens calculated with the U.S. Census Bureau’s Vintage 2023 and with the 2026 CBO projections was about 25,000 in 2022:Q3, but by 2023:Q1 it had become almost four times as large.
11 The Dallas Fed's recent work (Cheremukhin, 2025; and Cheremukhin et al., 2026) takes the story from this point onward, documenting the sharp fall in the breakeven as net international migration flows declined.