In March 2020, the onset of the Covid-19 pandemic triggered a liquidity crisis in the secondary market for municipal bonds in the United States.1 Mutual funds saw $43 billion worth of outflows in one month (shattering previous records), yields spiked, and the Federal Reserve intervened directly in municipal debt markets for the first time in its history (Cipriani et al., 2020). These severe dislocations in the secondary market essentially froze new municipal bond issuance for a month, cutting off state and local governments from a crucial source of funding for infrastructure projects, such as roads, hospitals, and schools.
This brief episode of financial stress illustrated significant vulnerabilities in the municipal bond market that may arise again in future crises. Considering these events, we believe there is a need for high-frequency, public tools monitoring the systemic stability of the municipal bond market. In this Chicago Fed Letter, we examine simple high-frequency metrics of transactions costs in the municipal bond market. These metrics, which we explain in greater detail in the next section, are an important subset of the Chicago Fed’s MuniTrack—which we recently introduced to provide a comprehensive overview of financial conditions in the U.S. municipal bond market.
The municipal bond market is often cited as one of the least liquid financial markets in the United States, where transactions costs are high and potential fragility in times of financial strain is also substantial.2 The municipal bond market, however, was not always illiquid. Biais and Green (2019) show that transactions costs in municipal bonds were only half as large in the years before the Great Depression as in the 2000s, attributing the stark difference to municipal bond trading migrating from centralized exchanges to over-the-counter markets in the late 1920s. Other academic experts have established that the high transactions costs in this market are at least in part driven by specialized dealers exerting considerable market power (Li and Schürhoff, 2019; and Jotikasthira et al., 2025).
Measuring transactions costs in the municipal bond market
One way to assess liquidity in the municipal bond market is to estimate transactions costs in different segments of the market. Measuring transactions costs, however, has been a difficult task because of the lack of readily available data until the late 1990s. Even today, key secondary market metrics typically available in other markets, such as pre-trade price quotes, are still mostly unavailable to most traders in the municipal bond market. Given these data limitations, perhaps the most reliable way to assess liquidity and transactions costs is by identifying chains of transactions that link a sale and a subsequent purchase of a given security. Many researchers and practitioner sources, therefore, compute round-trip costs as “markups” on transactions or intermediation chains that link a given customer sale transaction to the corresponding dealer and customer purchase transactions.3
Specifically, using municipal bond transactions data made available to the public by the Municipal Securities Rulemaking Board (MSRB), Green et al. (2007) were the first to link customer sale and purchase transactions for the same bond using the amount and the timing of transactions. The idea is that after a customer sells a position to a dealer, the dealer places the position with one or more other customers either directly or via other dealers. While the authors are unable to observe the identity of dealers in their data set, using transaction amounts to “complete” a trade sequence provides a reasonable approximation of placement patterns. The authors deem a completed trade sequence “round-trip transactions.” The customer sale–purchase price differential scaled by the purchase price—i.e., the markup—is therefore a measure of round-trip transactions costs. Since the publication of Green et al. (2007), many studies, including Green et al. (2010) and Chalmers et al. (2021), have used this concept to arrive at municipal bond transactions costs.
More recently, Li and Schürhoff (2019) construct round-trip transactions markups using the regulatory version of the MSRB data—namely, the Real-Time Transaction Reporting System (RTRS) data, which detail dealer identities for the universe of municipal securities market transactions. This approach allows for more accurate identification of round-trip transactions or intermediation chains than the public version of the MSRB data at commonly transacted amounts, which represent most secondary market trades. In this article, we rely on the exact same approach to compute measures of transactions costs in the municipal bond market.
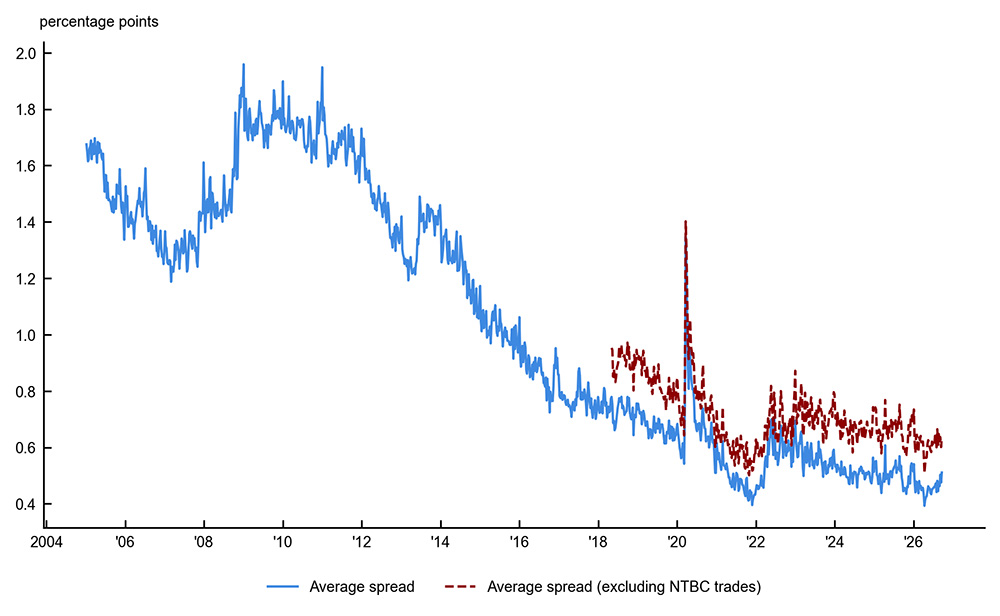
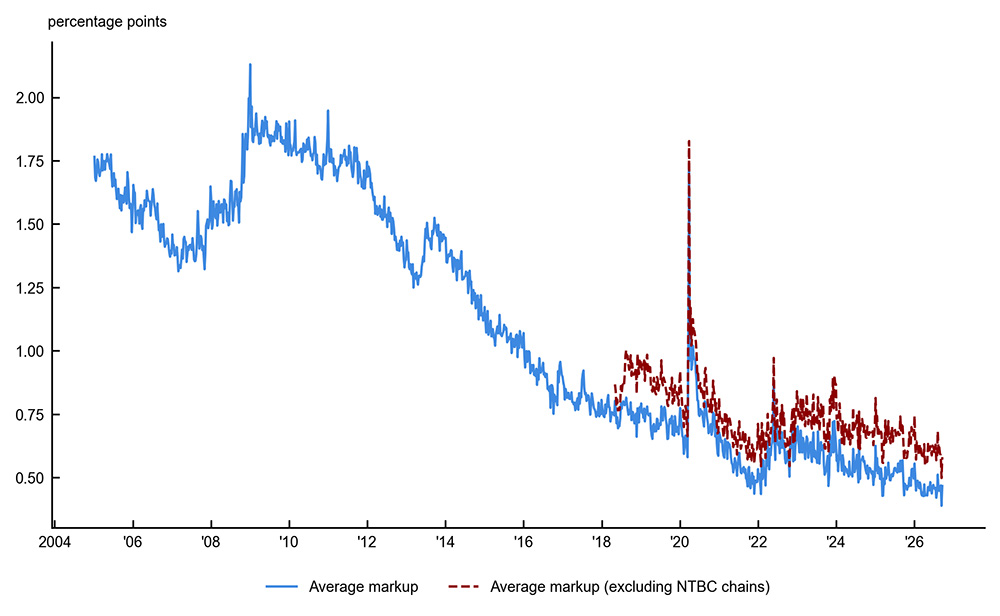
Finally, other studies measure municipal bond transactions costs using “effective spreads” on municipal bond spreads, defined as the difference between same-day volume-weighted average dealer-to-customer purchase prices and dealer-to-customer sale prices. While this approach intuitively represents a version of bid–ask spreads, it may understate total transactions costs in the municipal bond market because only a fraction of all intermediation chains are completed on the same day (Harris and Piwowar, 2006). In addition, this approach also does not account for differential intermediation costs across dealers. For example, average intermediation chain markups during the Great Recession of 2007–09 in Sirri (2014) are significantly higher than the effective spreads in Wu (2018). Comparing effective spreads to intermediation chain markups in panels A and B of figure 1 confirms this gap over the entire time series since the start of 2005, with the gap increasing during times of financial stress, such as the Covid-19 pandemic era.
1. Measures of municipal bond transactions costs
A. Effective spread
B. Markup on intermediation chains
Sources: Authors’ calculations based on data from the Municipal Securities Rulemaking Board (MSRB), The Bond Buyer, and Mergent Municipal Bond Database.
Transactions costs in the municipal bond market: Trends since 2005
Transactions costs in the municipal bond market have declined substantially since 2005, despite their high levels relative to such costs in other markets. Figure 1, panel B shows that Li and Schürhoff (2019) markups have declined from about 200 basis points during the Great Recession to about 60 basis points just before the pandemic. Furthermore, this decline has been most pronounced among the smallest trades, typically associated with retail investors: from about 230 basis points during the Great Recession to 70–80 basis points just before the pandemic (see the blue line in figure 4, which we discuss in depth later). As other researchers have discussed, this decline may be due to increased market transparency or due to technological improvements in electronic trading. For example, Chalmers et al. (2021) and Wu (2018) posit that the rise of electronic trading, the reporting of trades within 15 minutes of execution instead of within a day, and MSRB’s publishing of trades on a public platform (called Electronic Municipal Market Access, or EMMA) may all have substantially increased transparency in the municipal bond market.
These measures of transactions costs may be incomplete because roughly one-fifth of trades are compensated indirectly. In these transactions, dealers are compensated based on (bulk) trade contracts with customers, such as on an annual or a quarterly basis, instead of receiving a direct commission for each trade. Consequently, the prices and yields of these transactions in the MSRB data do not incorporate dealer compensation. This type of dealer compensation arrangement is known as non-transaction-based compensation (NTBC). Indeed, the dashed red line in panel B of figure 1 shows that average round-trip transactions costs are 10–20 basis points higher after excluding NTBC trades from the sample.
Furthermore, Choi et al. (2024) find that dealers in the corporate bond market increasingly pre-arrange trades—quickly match customers that trade in the opposite direction. Once such customer liquidity provision is accounted for, their study shows that the transactions costs of corporate bond trades in which dealers utilize inventory capacity have increased since the global financial crisis of 2008. Therefore, even though average transactions costs across all trades in the corporate bond market have decreased since the global financial crisis, their finding suggests that the price of immediacy has nonetheless increased.
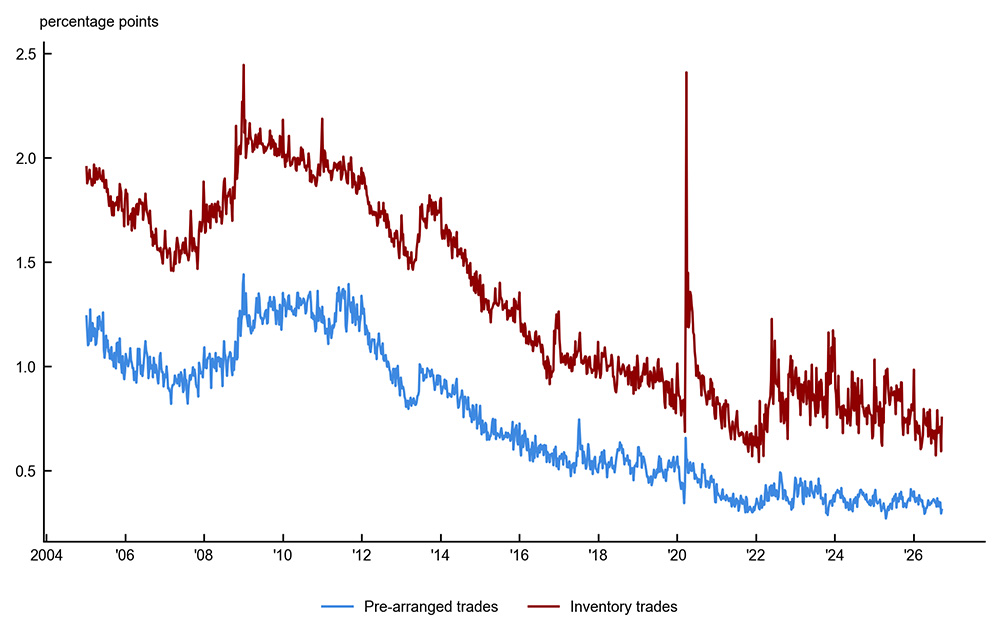
Given inventory trades are likely to be more informative about transactions costs than pre-arranged trades, we examine municipal bond markups within each subset of trades. We define inventory trades whenever the intermediation chain takes longer than 15 minutes to complete, while pre-arranged trades are those in which the intermediation chain is completed within 15 minutes. Figure 2 shows that markups on inventory trades are consistently higher than those on pre-arranged trades by about 75–100 basis points. Importantly, inventory trades also experience substantially larger increases in markups during times of financial stress, such as the Great Recession or the Covid-19 pandemic, than pre-arranged trades.
2. Markup of municipal bond transactions, by trade type
Sources: Authors’ calculations based on data from the Municipal Securities Rulemaking Board, The Bond Buyer, and Mergent Municipal Bond Database.
Despite the substantially higher markups of inventory trades, however, the overall trends in the municipal bond market are markedly different from those in the corporate bond market. Contrary to the findings of Choi et al. (2024) for the corporate bond market, figure 2 shows that transactions costs for inventory trades in the municipal bond market have declined substantially since the global financial crisis.
Transactions costs in the municipal bond market and the Fed’s monetary policy tightening
The large increase in average round-trip transactions costs since the second half of 2021 has likely been a byproduct of a multitude of economic forces related to the tightening of policy rates by the Federal Reserve between March 2022 and July 2023. Notably, two groups of institutional investors with a strong presence in the municipal bond market—banks and mutual funds—have substantially reduced exposure to municipal bonds since 2021.4 The sharp reduction in mutual fund municipal bond holdings has come in response to massive redemptions by mutual fund investors since the start of the 2022–23 monetary policy tightening cycle (Lerner, 2022). Similarly, banks have reduced municipal bond holdings among other fixed-income instruments to decrease the sensitivity of their portfolios to changes in interest rates. The lower presence of these key investors in the secondary market may have had a destabilizing effect on prices and increased volatility, thereby raising transactions costs. Furthermore, researchers have documented that interactions between contractionary monetary policy and tax policy may increase illiquidity and transactions costs in the municipal bond market (Bagley et al., 2023; and Wu and Ostroy, 2023).
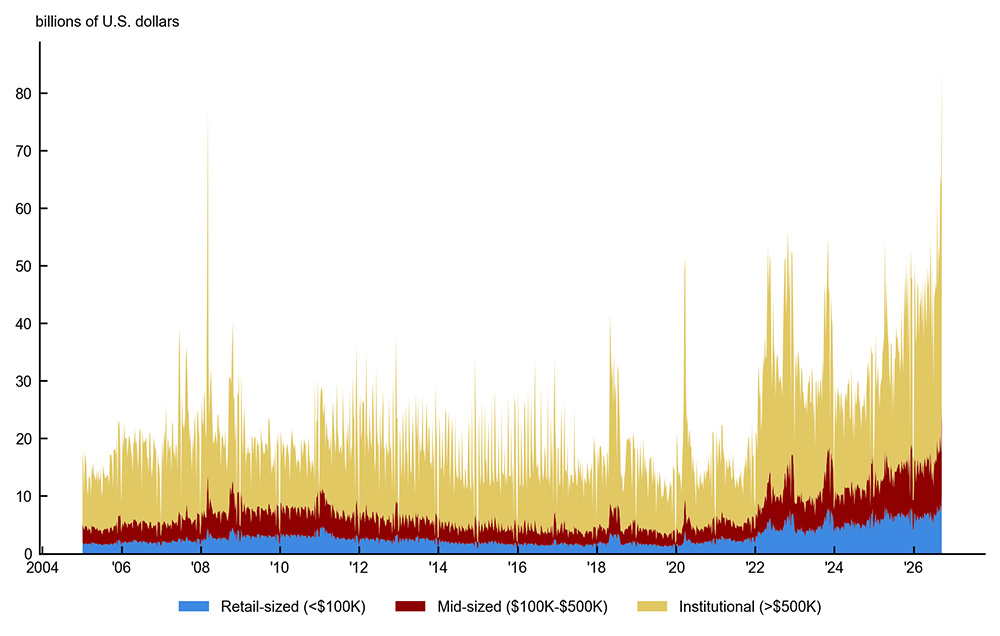
Consistent with these predictions, we find substantially higher markups in early 2022, around the start of the Federal Reserve’s 2022–23 monetary policy tightening cycle. This level shift in markups to about 40 to 60 basis points (figure 1, panel B) is accompanied by substantially higher transactions counts and volumes, among both institutional and retail investor trades (see figure 3). Markups have declined substantially since 2024 to levels last seen before the start of the Federal Reserve’s 2022–23 monetary policy tightening cycle.
3. Trading volume of municipal bond transactions
A. Total U.S. dollar value of transactions
B. Total count of transactions
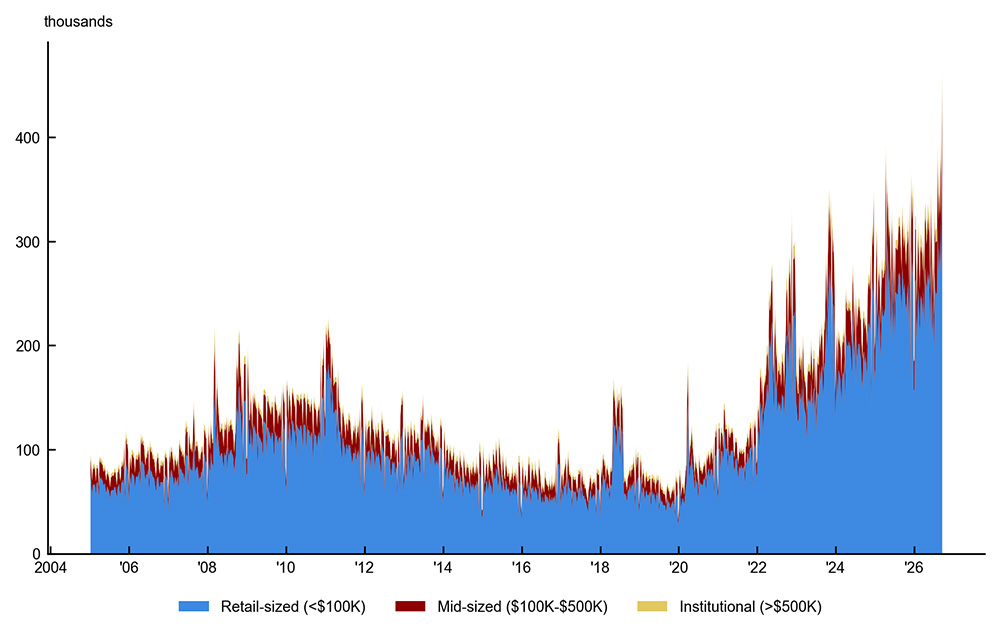
Source: Authors’ calculations based on data from the Municipal Securities Rulemaking Board (MSRB).
Figure 4 shows that the higher markups around the start of the Fed’s rate hikes in early 2022 have been most pronounced in absolute terms among retail-sized and mid-sized trades. Both series still hover close to pre-pandemic levels, but above levels prior to the start of the 2022–23 monetary policy tightening cycle. For example, average intermediation chain markups for retail-sized trades increased from about 50 basis points to over 75 basis points between 2021 and 2022, while mid-sized trades experienced an increase from 35 basis points to about 50 basis points. Most recently, the markups on both series have converged to slightly below 50 basis points. By contrast, markups for institutional trades are now slightly above 20 basis points. These results indicate that transactions costs in the retail-sized segment are particularly sensitive to contractionary monetary policy. This could be a byproduct of low liquidity in the retail sector that gets further amplified in times of financial stress.
4. Markup of municipal bond transactions, by intermediation chain size
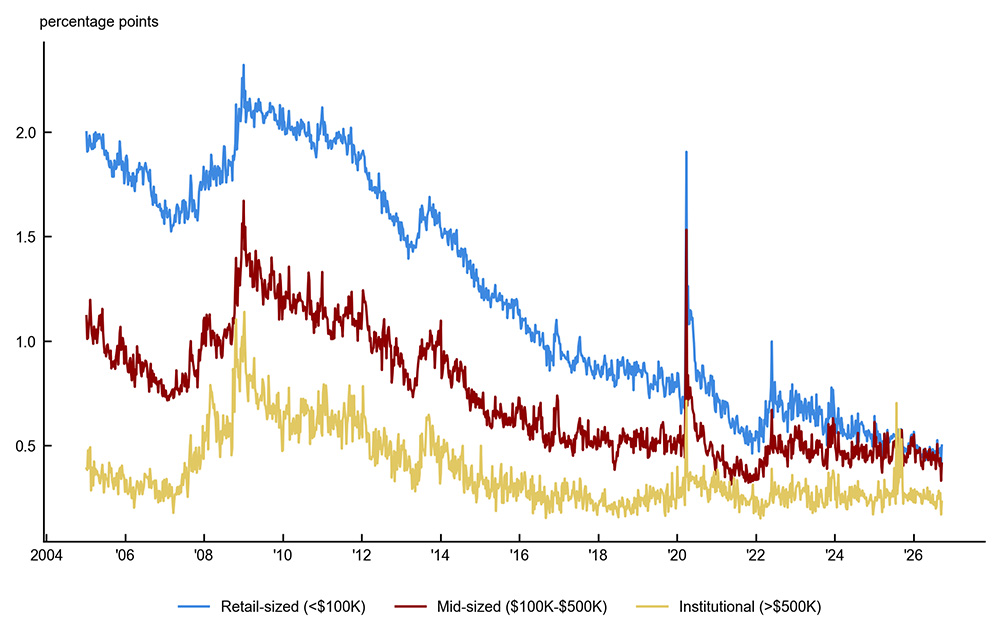
Sources: Authors’ calculations based on data from the Municipal Securities Rulemaking Board, The Bond Buyer, and Mergent Municipal Bond Database.
Looking back at figure 2, we note that most of the variation in round-trip transactions costs in the recent period comes from inventory trades. Most recently, inventory trades hover around 60–70 basis points and exhibit substantial volatility. By contrast, pre-arranged trades are more stable at under 40–50 basis points.
Conclusion
We document recent transactions cost trends in the municipal bond market. Using a measure of round-trip transactions costs based on Li and Schürhoff (2019), i.e., intermediation chain markups, we document large secular declines in such costs since 2010. Despite these substantial declines, transactions costs are likely to spike during financial crises or episodes of high economic uncertainty, such as the Covid-19 period or the start of a Federal Reserve monetary policy tightening cycle. Furthermore, such sharp increases in transactions costs during times of economic uncertainty are especially relevant to the set of trades that utilize the inventory capacity of municipal bond dealers.
Details for Ivan Ivanov are available on his Federal Reserve Bank of Chicago online profile (accessed by clicking his name in the byline). A former research assistant at the Chicago Fed, Andrew Souther is currently a PhD candidate in economics at Columbia University.
Notes
1 The secondary market for municipal bonds is where existing bonds are bought and sold after their initial issuance (in the primary market).
2 See, e.g., Gillers and Banerji (2020) and Devitt (2023).
3 Round-trip costs are the costs investors incur if they are to sell a bond to a dealer and then buy it back.
4 See tables F.122 and F.111 in Board of Governors of the Federal Reserve System (2024).