How Are Chicago and Detroit Spending Their Local Fiscal Recovery Funds?
Part of the U.S. federal government’s American Rescue Plan Act (ARPA) is economic assistance for state, local, and tribal governments. This assistance is distributed through the Coronavirus State and Local Fiscal Recovery Funds (SLFRF) program. Funds allocated by the program can only be used for costs incurred after March 3, 2021, and they must be obligated by the end of 2024 and spent by the end of 2026. While the possible uses are flexible, recipients are not allowed to use their SLFRF allocations to offset losses in tax revenue that resulted from a change in law, pay debts, or replenish rainy day funds. Overall, the SLFRF program has allocated $350 billion to state, local, and tribal governments. However, the actual final total in SLFRF spending will depend on cities and other units of government identifying programs that comply with the approved expenditure categories for the funds.
In this blog post, we examine how Chicago and Detroit—two of the larger cities in the Seventh Federal Reserve District—intend on spending their SLFRF allocations, as well as the pattern of potential expenditures for city governments within each District state.1 In certain respects, the SLFRF program represents a unique experiment in federal aid to states and cities. This federal aid program differs from previous ones in that the use of funds by state and city governments has significant flexibility and is intended to be tailored to ameliorate local impacts from the pandemic. As we will show, this leads to city governments prioritizing different uses for the federal dollars. Understanding and tracking the use of this money may provide us insights on the impact and effectiveness of federal aid to state and city governments.
Policy background
SLFRF funding is allocated to recipients based on population and economic conditions during or shortly before the pandemic.2 For example, metropolitan areas receive funding based on the formula used by the Community Development Block Grant (CDBG) program. The formula accounts for information on a city’s population, population growth, level of poverty, average proportion of housing built before 1940, and the extent of housing overcrowding. Once a recipient receives its SLFRF allocation, that federal funding can be used in a variety of ways. As of April 2022, the U.S. Department of the Treasury’s final rule has outlined several categories of primary allowable uses for SLFRF funding: addressing public health impacts of Covid-19; responding to the negative economic impacts of Covid-19; providing premium pay for essential workers; investing in broadband and water/sewer infrastructure; and replacing lost public sector revenue due to the pandemic. The Treasury permits SLFRF funding to be used for another category that combines two of these primary uses—addressing public health impacts and responding to negative economic impacts. The use of SLFRF funding within these broad categories is very flexible, though the final rule also suggests this funding be used to help communities disproportionately impacted by the pandemic. The Treasury’s final rule also allows for a final expenditure category for the funds: SLFRF funding can be used for administrative costs, such as hiring consultants to advise governments on how best to allocate their funds.
SLFRF recipients are organized in five tiers:
- Tier 1 recipients are states, territories, and cities/counties with a population above 250,000.
- Tier 2 recipients are cities and counties with a population below 250,000 that received more than $10 million in funding and non-entitlement units of local government (NEUs) that received more than $10 million in funding.3
- Tier 3 recipients are tribal governments that received more than $30 million in funding.
- Tier 4 recipients are tribal governments that received less than $30 million in funding.
- Tier 5 recipients are cities and counties with a population below 250,000 that received less than $10 million in funding and NEUs that received less than $10 million in funding.
Tier 1, 2, and 3 recipients must submit quarterly project and expenditure reports. The Treasury provides further details on recipient compliance and reporting responsibilities under the recipient compliance and reporting guidance section on this webpage.
Public sector revenue replacement has been quite a popular category, according to our analysis. This is because, thanks to the final rule’s revenue loss provision, funds allocated to revenue replacement are easier for governments to spend. This category is popular also because it has fewer restrictions and less stringent reporting requirements than the others.
Data
Some of these quarterly reports are available in PDF format on city government websites. However, these reports are also summarized in Microsoft Excel files available under the public reporting section at the bottom of the Treasury’s SLFRF compliance webpage. We use the data contained in the most recent publicly available file, which compiles details from the quarterly reports submitted by tier 1 and tier 2 recipients (the Treasury omits information on tribal governments for the sake of their privacy). Each recipient completes quarterly reports by filling out a standardized form on the Treasury’s website. Each report consists of a list of the recipient’s planned projects—which includes project-specific information such as a project’s name, description, SLFRF spending category, status to completion, adopted budget, cumulative obligations, and cumulative expenditures. However, tier 2 recipients are not required to disclose their adopted budget for each project; when a recipient chooses not to disclose this information, each project’s cumulative obligations and expenditures are the only available SLFRF-use data. The Treasury compiles such details from these reports into one data set where each observation is a recipient–project pair. We use this information as-is to classify SLFRF spending in Chicago and Detroit (both of which are tier 1 cities). We also aggregate SLFRF budgets, obligations, and expenditures and average these values across geographic areas. This allows us to compare SLFRF usage in Chicago and Detroit with SLFRF usage in cities across the Midwest and the United States.
Summary statistics
Figures 1, 2, and 3 summarize how cities within certain geographic areas have planned to use their SLFRF allocations, on average. The data include recipient cities, townships, and villages within the first two reporting tiers and exclude state- and county-only recipients. In this post, we refer to all of these recipients as “cities.” (The exception to this is the governmental unit of Indianapolis and Marion County, Indiana—which is included among the cities, although technically it’s a consolidated city–county government under the administration of the Indianapolis government.)
The first three sets of rows in figure 1 show the average planning for SLFRF allocations among cities within specified geographic areas. The fourth set shows the true values for the single city recipients—Chicago and Detroit—featured in this blog post. Recall that tier 2 recipients are not required to report their adopted budgets for projects. Thus, in figure 1, the percentage of the average recipient’s total allocation that’s been budgeted may be lower than the true value: Tier 2 recipients that do not report their budgeted amounts will receive a zero value in the data, attenuating the overall average. This also means that the percentage obligated can exceed the percentage budgeted. The last two columns of figure 1 show the percentages of the total SLFRF allocation that has been obligated and expended. These values are reported for each project, aggregated for each recipient, and then averaged across recipients. On average, recipients have only budgeted about half of their allocated funding and expended closer to a quarter of it. Even Chicago—which has budgeted all of its SLFRF allocation—has expended just over 60% of it. It is evident that there remains a lot of spending to be done before the December 31, 2026, deadline.
1. Average overall use planning among recipient cities of Coronavirus State and Local Fiscal Recovery Funds (SLFRF) allocations, by geographic area, as of 2022:Q4
| Geographic area | Cities within geographic area | Total SLFRF allocation in U.S. dollars |
Percentage of SLFRF allocation budgeted |
Percentage of SLFRF allocation obligated |
Percentage of SLFRF allocation expended |
|---|---|---|---|---|---|
| Country |
Cities within the 50 states and the District of Columbia |
159,502,732.75 | 50.69 | 43.46 | 27.66 |
| Census region/division | Cities within Midwest region/West North Central division | 178,227,396.25 | 68.21 | 44.36 | 25.12 |
| Cities within Midwest region/East North Central division | 160,349,723.75 | 43.96 | 40.22 | 25.42 | |
| State | Cities within Illinois | 436,683,783.23 | 58.33 | 49.03 | 40.92 |
| Cities within Indiana | 100,478,511.99 | 47.65 | 49.73 | 26.90 | |
| Cities within Iowa | 33,713,407.81 | 53.13 | 48.25 | 17.02 | |
| Cities within Michigan | 107,624,565.14 | 37.38 | 33.35 | 17.91 | |
| Cities within Wisconsin | 81,211,296.41 | 45.72 | 27.66 | 16.48 | |
| Single city recipient | Chicago | 1,886,591,388.00 | 100.00 | 68.05 | 63.65 |
| Detroit | 826,675,290.00 | 60.00 | 31.35 | 6.13 |
Source: Authors’ calculations based on data from the U.S. Department of the Treasury, Coronavirus State and Local Fiscal Recovery Funds program.
Figure 2 shows the average funding distribution among all city government recipients that reported their SLFRF spending in the fourth quarter of 2022. On average, revenue replacement is the largest budgeted spending category, with responding to negative economic impacts coming in second. Similarly, figure 3 shows the same statistics for each state in the Seventh District. As with the nation, revenue replacement is the top SLFRF spending category for Illinois, Indiana, and Michigan. Wisconsin’s top category is responding to negative economic impacts. And Iowa is the only Seventh District state to have infrastructure in the lead (almost 61% of its budgeted funds are for that category).
2. National average distribution of cities’ Coronavirus State and Local Fiscal Recovery Funds (SLFRF) allocations, by expenditure category, as of 2022:Q4
| Expenditure category | Percentage of total SLFRF allocation budgeted | Percentage of total SLFRF allocation obligated | Percentage of total SLFRF allocation expended |
|---|---|---|---|
| Public health | 7.99 | 6.36 | 4.08 |
| Negative economic impacts | 23.28 | 15.23 | 9.06 |
| Public health–negative economic impacts: Public sector capacity | 7.00 | 7.96 | 5.69 |
| Premium pay | 3.63 | 5.40 | 5.05 |
| Infrastructure | 18.15 | 15.30 | 7.91 |
| Revenue replacement | 33.55 | 30.44 | 18.70 |
| Administrative | 2.74 | 2.12 | 1.19 |
| Not yet used | 3.67 | 17.20 | 48.31 |
Source: Authors’ calculations based on data from the U.S. Department of the Treasury, Coronavirus State and Local Fiscal Recovery Funds program.
3. Each Seventh District state’s average distribution of cities’ Coronavirus State and Local Fiscal Recovery Funds (SLFRF) allocations, by expenditure category, as of 2022:Q4
| State | Expenditure category | Percentage of total SLFRF allocation budgeted | Percentage of total SLFRF allocation obligated | Percentage of total SLFRF allocation expended |
|---|---|---|---|---|
| Illinois | Public health | 8.67 | 2.39 | 1.53 |
| Negative economic impacts | 13.31 | 6.99 | 3.79 | |
| Public health–negative economic impacts: Public sector capacity | 6.50 | 6.17 | 4.20 | |
| Premium pay | 2.10 | 3.48 | 3.35 | |
| Infrastructure | 13.35 | 15.31 | 12.76 | |
| Revenue replacement | 46.42 | 31.06 | 24.04 | |
| Administrative | 2.88 | 3.17 | 1.23 | |
| Not yet used | 6.78 | 31.42 | 49.09 | |
| Indiana | Public health | 11.29 | 5.98 | 2.32 |
| Negative economic impacts | 17.26 | 17.56 | 14.33 | |
| Public health–negative economic impacts: Public sector capacity impacts: Public sector capacity | 3.28 | 2.62 | 2.57 | |
| Premium pay | 5.31 | 5.74 | 5.63 | |
| Infrastructure | 13.98 | 20.80 | 5.82 | |
| Revenue replacement | 18.29 | 26.87 | 16.29 | |
| Administrative | 0.33 | 0.34 | 0.25 | |
| Not yet used | 30.26 | 20.10 | 52.81 | |
| Iowa | Public health | 2.16 | 6.57 | 4.28 |
| Negative economic impacts | 3.95 | 42.90 | 6.84 | |
| Public health–negative economic impacts: Public sector capacity | 0.22 | 1.52 | 1.27 | |
| Premium pay | 0.62 | 0.62 | 0.62 | |
| Infrastructure | 60.80 | 15.97 | 6.83 | |
| Revenue replacement | 27.90 | 13.49 | 9.41 | |
| Administrative | 0.00 | 0.00 | 0.00 | |
| Not yet used | 4.35 | 18.93 | 70.75 | |
| Michigan | Public health | 1.20 | 4.26 | 3.46 |
| Negative economic impacts | 19.48 | 19.32 | 8.63 | |
| Public health–negative economic impacts: Public sector capacity | 2.24 | 1.99 | 1.58 | |
| Premium pay | 1.63 | 3.41 | 2.78 | |
| Infrastructure | 15.25 | 13.68 | 3.94 | |
| Revenue replacement | 29.49 | 18.80 | 12.13 | |
| Administrative | 2.30 | 1.99 | 0.81 | |
| Not yet used | 28.41 | 36.57 | 66.67 | |
| Wisconsin | Public health | 7.41 | 2.74 | 1.19 |
| Negative economic impacts | 23.41 | 12.20 | 5.59 | |
| Public health–negative economic impacts: Public sector capacity | 4.73 | 1.53 | 1.39 | |
| Premium pay | 1.67 | 1.67 | 1.67 | |
| Infrastructure | 9.44 | 21.16 | 19.05 | |
| Revenue replacement | 18.23 | 16.37 | 7.20 | |
| Administrative | 1.47 | 0.53 | 0.21 | |
| Not yet used | 33.64 | 43.80 | 63.70 |
Source: Authors’ calculations based on data from the U.S. Department of the Treasury, Coronavirus State and Local Fiscal Recovery Funds program.
Chicago
As shown in figure 4, Chicago has budgeted most of its funding for revenue replacement, which is consistent with the average budget distributions for all cities in the state of Illinois and in the entire nation. Recall that SLFRF dollars budgeted for the revenue replacement category are relatively easier to spend (moreover, these SLFRF expenditures have less stringent reporting requirements and are generally not project-based). Given this, we focus on Chicago’s second-largest budgeted category, which is responding to negative economic impacts—which also comes in second for cities in the nation, but third for cities in Illinois.
4. Chicago’s distribution of budgeted Coronavirus State and Local Fiscal Recovery Funds (SLFRF) allocation, as of 2022:Q4
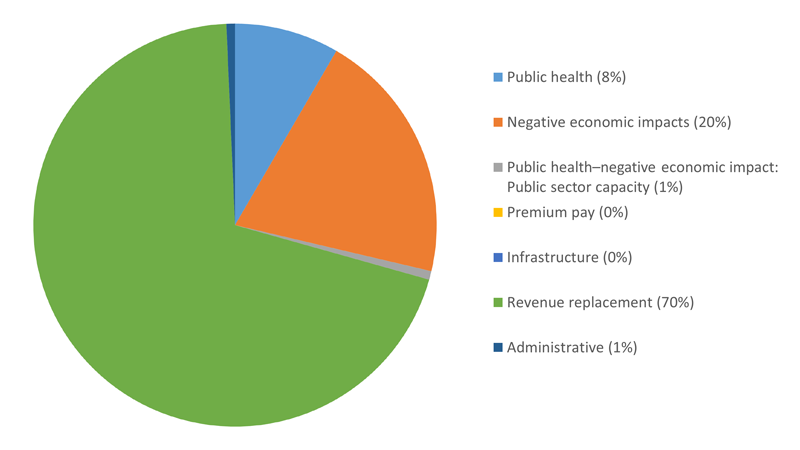
Source: Authors’ calculations based on data from the U.S. Department of the Treasury, Coronavirus State and Local Fiscal Recovery Funds program.
Chicago’s largest project for mitigating negative economic impacts is for youth opportunity programs. The project is split into three different programs, all under the umbrella of One Summer Chicago. One program is Chicagobility, which is a career-exploration program for 14–15 year olds, designed to help them build skills through project-based learning. The other two are the Summer Youth Employment Program and the Chicago Youth Service Corps, which provide development-focused employment to 16–24 year olds. The city has budgeted $53,800,000 for this project. As of the fourth quarter of 2022, this project is classified as being “less than 50% completed” because the contracts created within the Chicago Youth Service Corps will run through December 31, 2023, with the possibility for an extension through December 31, 2024. The project had $14,525,415 in cumulative obligations and $7,718,119 in cumulative expenditures as of year-end 2022.
Detroit
Detroit’s largest budgeted category is responding to negative economic impacts, which is the second-largest category for cities in Michigan and in the nation on average. It is worth noting, however, that Detroit has only budgeted about 60% of its total allocated SLFRF funding, so these categories may shift in the next few years.
5. Detroit’s distribution of budgeted Coronavirus State and Local Fiscal Recovery Funds (SLFRF) allocation, as of 2022:Q4
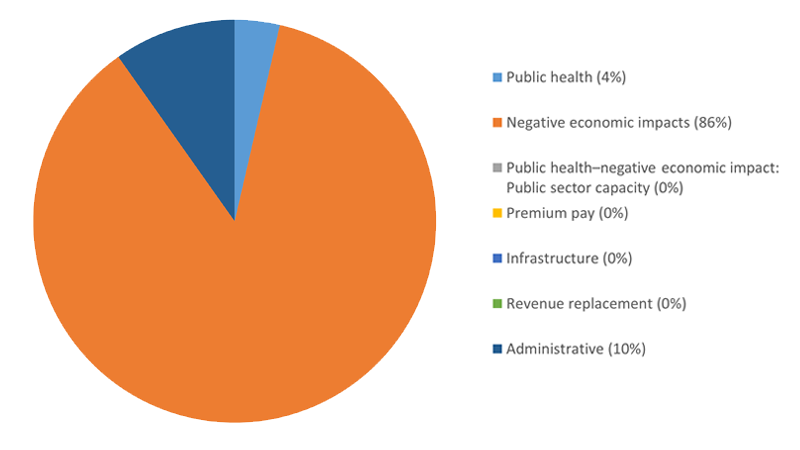
Source: Authors’ calculations based on data from the U.S. Department of the Treasury, Coronavirus State and Local Fiscal Recovery Funds program.
The city’s largest project for counteracting negative economic impacts is blight remediation for industrial and commercial areas—i.e., removing and remedying abandoned commercial and industrial structures. The project’s primary emphasis is on using blight remediation—which removes barriers to (re)development—to promote economic stability. The project is less than halfway completed as of the fourth quarter of 2022. The City of Detroit adopted an $87,875,000 budget for the project; it had $6,624,943 in cumulative obligations and $1,288,367 in expenditures as of year-end 2022.
Conclusion
SLFRF recipients have several more years to spend their funds, but many have already initiated projects with the federal dollars. Chicago and Detroit—two major Seventh District cities—have allocated much of their funding to labor force recovery and blight remediation, respectively. Chicago’s initiative is focused on youth skill-building and employment, and Detroit’s program is intended to improve neighborhoods and promote local (re)development. The cities’ largest projects are quite different from one another in scope and show how city governments’ priorities vary across the Seventh District. This post is but the first step in what will surely be years of study on the effects of SLFRF funding.
Some parting thoughts
There are some things to keep in mind when tracking the impact of the SLFRF allocations. First, the need to fully expend the money by the end of 2026 may limit some creativity in the use of the federal money. Building new structures or programs to use the resources in such a short time frame will be difficult at best and will pressure some governments to spend the money through existing channels. Second, money being spent on social programs will require the identification of future funding sources if these programs are to be maintained once the SLFRF money is exhausted. Programs addressing poverty and inequality likely require sustained efforts that will be jeopardized if these programs are overly dependent on short-term funding. Finally, for governments using the money for infrastructure, the current tightness in the construction labor market and increases in project costs mean that infrastructure dollars are not going as far as they were before the pandemic. Given these factors, pressure on infrastructure-related investments is likely to persist even as SLFRF dollars are supplemented with funding from the $1 trillion Infrastructure Investment and Jobs Act of 2021.
Notes
1 The Seventh Federal Reserve District comprises all of Iowa and most of Illinois, Indiana, Michigan, and Wisconsin. For our analysis in this post, we consider the pattern of potential expenditures for city governments within the entirety of each of the five District states.
2 For more information on the allocation methodology, refer to the files located under the allocation information section of the U.S. Department of the Treasury’s SLFRF webpage.
3 Non-entitlement units of local government (NEUs) are local units of government that typically serve jurisdictions with populations below 50,000.


