Early Benchmarking the State Payroll Employment Survey—Update
In June of 2015, I wrote a blog post detailing a method called early benchmarking, which predicts how the U.S. Bureau of Labor Statistics (BLS) will revise the state payroll employment survey data when it updates its benchmarks each March (the method was first introduced by our colleagues at the Dallas Fed). The primary source of the revisions for state payroll employment (also known as the Current Employment Statistics, or CES) is the Quarterly Census of Employment and Wages (QCEW). While the BLS only rebenchmarks the CES using new QCEW data yearly, QCEW data are released quarterly, so it’s possible to use new QCEW data to predict how the BLS will revise the CES (this process is explained in detail in my earlier post). Benchmark revisions to the CES can be quite large, and we have found that our early benchmarking procedure typically reduces their size.
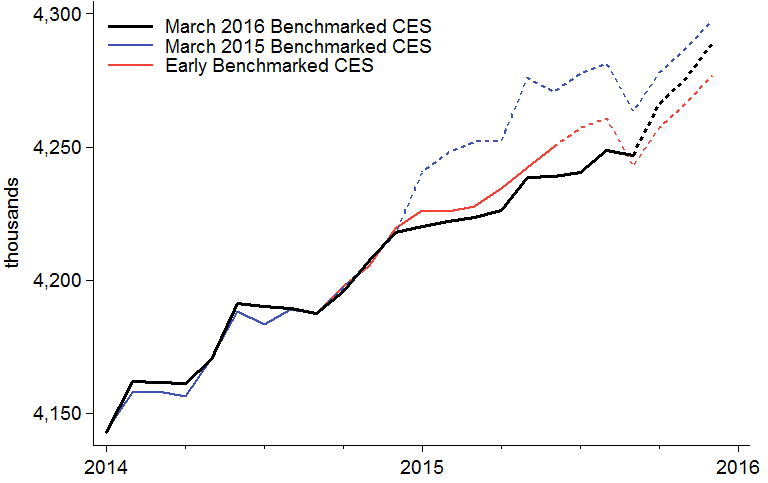
The BLS recently released the March 2016 benchmarked data, so we can see how the early benchmarking method performed for the Seventh Federal Reserve District and the District states for 2015. Table 1 summarizes how much employment grew in the Seventh District and District states in 2015 based on when the data were benchmarked using the QCEW. At the District level, the early benchmarking procedure performed marginally better: It underestimated job growth by 32,000, while data benchmarked in March 2015 underestimated job growth by 38,000. Both datasets estimated a 1.1 percent growth rate for 2015.
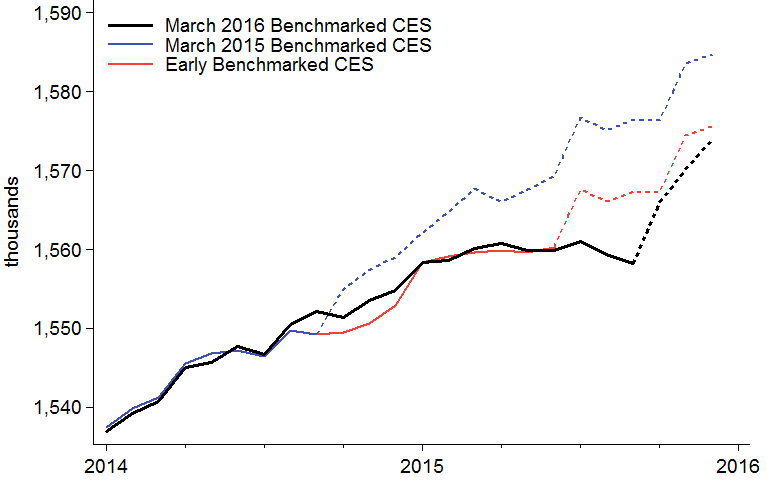
Early benchmarking is more useful at the state level, because CES sample sizes are smaller. For 2015, the largest error was for Illinois, where the March 2015 benchmarked data estimated that employment declined by 3,000, while the March 2016 benchmarked data indicate that employment actually increased by 51,000. The January 2016 benchmarked data roughly split the difference, estimating job growth of 29,000.
Table 1. Nonfarm job growth in the Seventh District in 2015, by benchmark type (thousands)
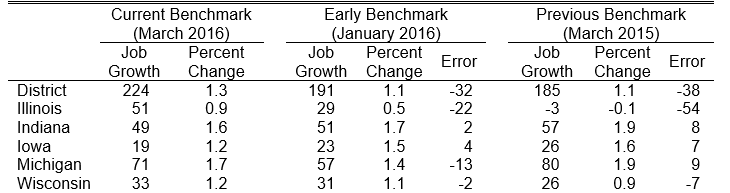
Sources: Author's calculations based on data from the U.S. Bureau of Labor Statistics' Current Employment Statistics and Quarterly Census of Employment and Wages, all from Haver Analytics.
The figures that follow show graphically the differences between the three series summarized in table 1 for the District and District states. The dashed portion of the lines for each series represents data that are not benchmarked using the QCEW. For example, the early benchmarked data are benchmarked using QCEW data through June 2015, while the March 2016 benchmarked data use QCEW data through September 2015. In some figures it is clear that the BLS also revises already-benchmarked data, though these revisions are typically small (Wisconsin is an exception for 2014).
Later this year, we will begin publishing early benchmarked estimates of District and District state employment growth on our website on a monthly basis (coinciding with the release of the Midwest Economy Index). We will be sure to notify our Midwest Economy blog readers when we make the estimates available.
Figure 1. Seventh District employment
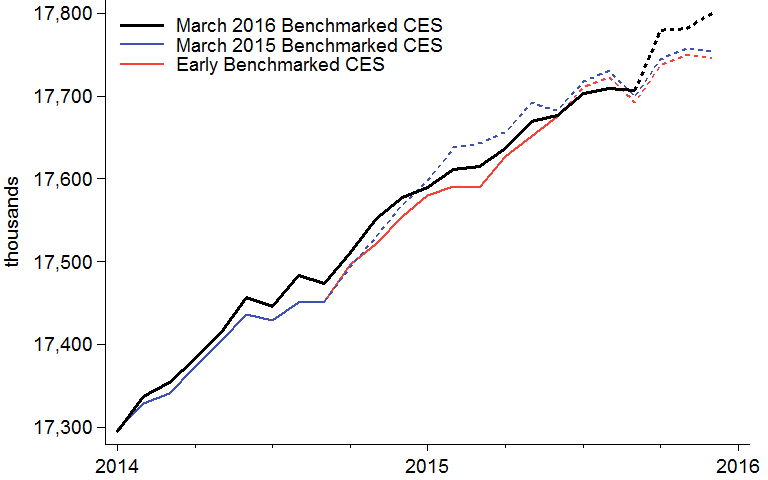
Sources: Author's calculations based on data from the U.S. Bureau of Labor Statistics' Current Employment Statistics (CES) and Quarterly Census of Employment and Wages (QCEW), all from Haver Analytics.
Figure 2. Illinois employment
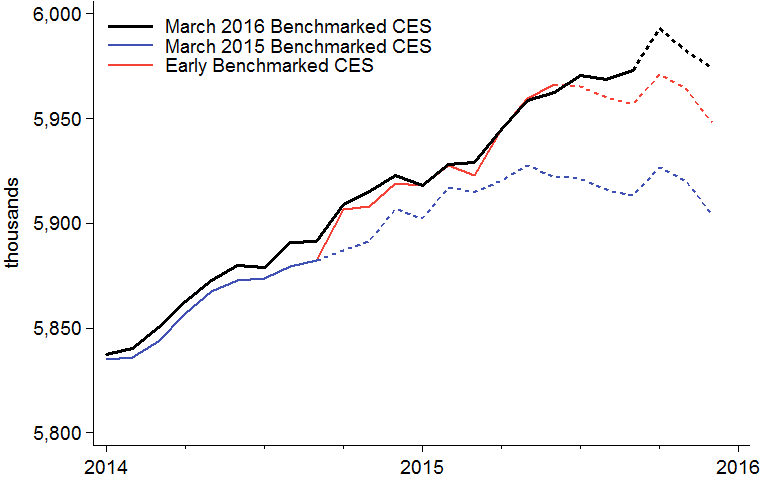
Sources: Author's calculations based on data from the U.S. Bureau of Labor Statistics' Current Employment Statistics (CES) and Quarterly Census of Employment and Wages (QCEW), all from Haver Analytics.
Figure 3. Indiana employment
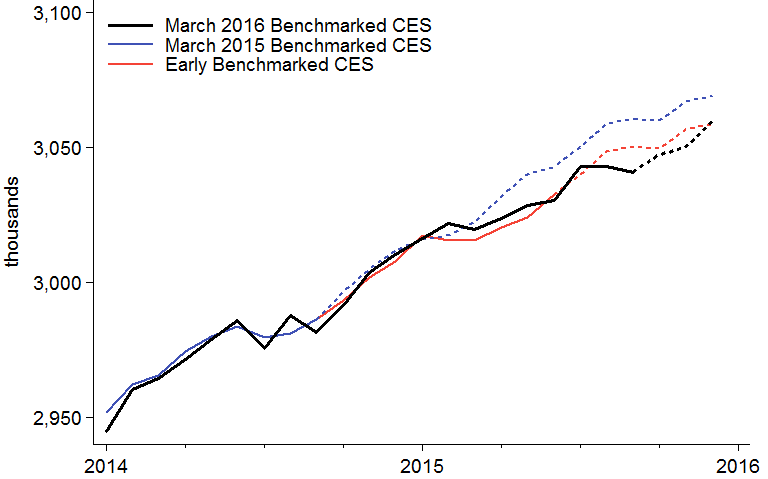
Sources: Author's calculations based on data from the U.S. Bureau of Labor Statistics' Current Employment Statistics (CES) and Quarterly Census of Employment and Wages (QCEW), all from Haver Analytics.
Figure 4. Iowa employment
Sources: Author's calculations based on data from the U.S. Bureau of Labor Statistics' Current Employment Statistics (CES) and Quarterly Census of Employment and Wages (QCEW), all from Haver Analytics.
Figure 5. Michigan employment
Sources: Author's calculations based on data from the U.S. Bureau of Labor Statistics' Current Employment Statistics (CES) and Quarterly Census of Employment and Wages (QCEW), all from Haver Analytics.
Figure 6. Wisconsin employment

Sources: Author's calculations based on data from the U.S. Bureau of Labor Statistics' Current Employment Statistics (CES) and Quarterly Census of Employment and Wages (QCEW), all from Haver Analytics.


