

The following publication has been lightly reedited for spelling, grammar, and style to provide better searchability and an improved reading experience. No substantive changes impacting the data, analysis, or conclusions have been made. A PDF of the originally published version is available here.
Based on economic fundamentals, the current recession shouldn’t be happening. The economy was headed for, in fact had probably achieved, the often-discussed but never experienced soft landing envisioned by policymakers and analysts alike. Unfortunately, having landed safely at the airport, the economy was struck by a runaway oil truck while taxiing to the gate. The damage came not so much from the accident—it wasn’t that large a truck—but from worries about whether there were any more runaway trucks lurking just out of sight.
Understanding what happened and why is important if we are to learn the right lessons from the recent past. It would be easy but false to say that the current recession shows once again the futility of fine tuning the economy through policy, and that the only way to tame inflation is a good old-fashioned recession. In fact, careful examination of the economic data suggests that without the massive increase in uncertainty that hit the economy in the wake of the Iraqi invasion of Kuwait, inflation would have been brought back under control without a recession and economic growth would have remained positive for the foreseeable future.
The soft landing
The assessment of the economy before the invasion hinges on two questions: Were we going to sidestep a recession? and was inflation headed back down? I believe the answer to both of these questions is yes.
There is disagreement about what would have occurred in the fourth quarter of 1990 if there had been no invasion, but a number of factors point to continued growth. Up until October the new NBER index of leading indicators1 and the related recession forecasting equation forecasted only a 6% chance of a recession. The reason for such a low probability is that none of the normal danger signals were flashing. Inventory-sales ratios in manufacturing had been decreasing for over a year, rather than increasing. Manufacturing employment also had been falling for over a year and a half. As figure 1, panels a) and b) show, this is highly atypical for the beginning of a recession. Also, as shown in figure l, panel c), interest rates have been falling for over a year, normally indicating an upsurge rather than a further decline in output.
1. Past and present
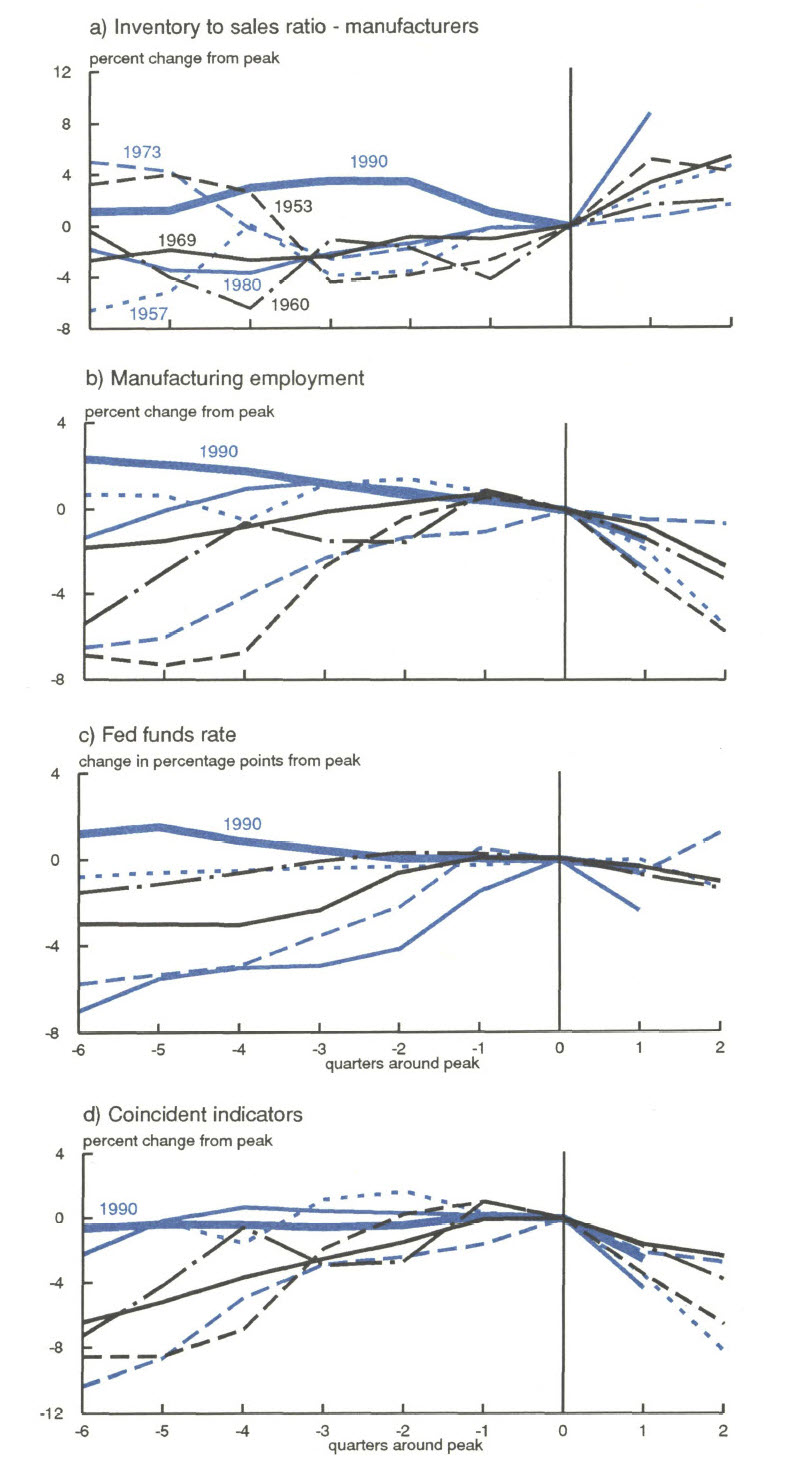
GNP from the third quarter of 1988 to the third quarter of 1990 averaged 1.5% growth, far below the 4.2% average of the preceding five years. As figure 1, panel d) shows, the coincident indicator index had been flat for over a year rather than rising to a peak as it normally does prior to a recession. The third quarter could be called a cyclical peak only in the loosest sense of the word. It would be characterized more accurately as the end of a flat. This extended period of slow growth experienced over the last two years generated the adjustments in inventories and employment, noted earlier, that are typically associated with the later stages of a recession rather than its beginning.
In short, the real economy had experienced enough weakness to initiate the recession adjustment process without actually entering a recession. Simply put, we had a soft landing.
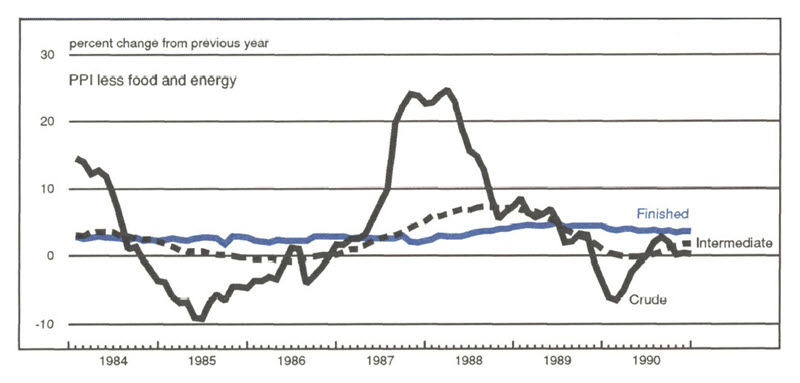
On the price side we see much the same story except delayed. Figure 2 shows that the inflationary pressures that had built up in the production process during 1988 and early 1989 began to ease off substantially in 1990.
2. Price pressures eased in 1990
Further, aggregate wage pressures began to ease in the third quarter of 1990 and would likely have eased further in the fourth quarter even without the added impetus of the recession. The reason for this belief is that the aggregate wage numbers were pushed up in the first half of 1990 not by higher wage gains but because manufacturing wages were not falling as fast as they had earlier in the decade. Manufacturing wages fell only 0.2% in the first half of 1990, in comparison to the average annual decline of 1% on a real basis from 1987 to 1989. No one would argue that falling real wages are a source of inflation. The real strength in wages during the ‘80s, and the source of potential wage-based inflation, was service sector wage growth, which peaked in 1989, as shown in figure 3.
3. Service wage pressures peaked in 1989
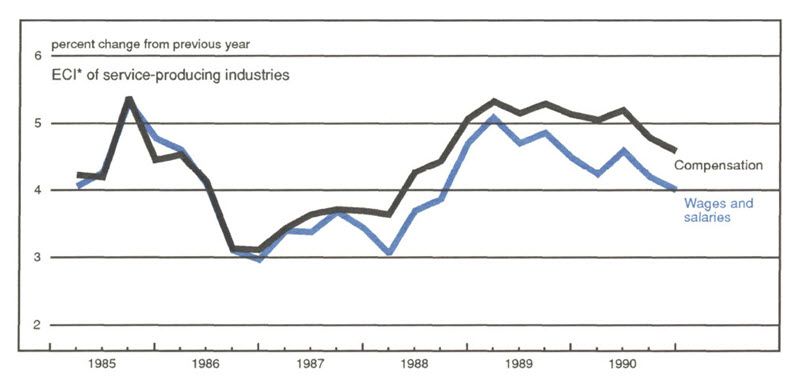
Source: Bureau of Labor Statistics.
Complicating the inflation picture, the CPI continued to show increased price pressures in 1990, rising in the first half of 1990 at a rate of 5.9% (annualized). It had been 3.6% in the last half of 1989. However, much of this increase was due to a series of special factors unlikely to repeat in the future. For instance, a major culprit in the observed acceleration of inflation in the first half of 1990 was shelter costs, which, according to the numbers, increased 2.9% between December 1989 and June 1990, causing the CPI to increase 0.8%, and accounting for 27% of the total acceleration. Anyone active in the housing market at the time knows this is sheer nonsense. The CPI’s use of the very thin rental markets to estimate overall housing costs generated this statistical fluke. Complicating the shelter picture were some increases in temporary lodging costs that seem to have been generated by a shift in hotel chain pricing policies, as casual travelers stayed home and the hotel chains focused pricing on less price-sensitive business travelers.
The other major special factors operating in the first quarter of 1990 were the heavy discounting that occurred during Christmas of 1989 and the bankruptcies of several large retail chains that caused apparel prices and some related goods to jump in price after Christmas. Similarly, some large-scale consolidations in movie theater chains boosted movie prices and generated a blip in entertainment prices.
Thus, while the CPI inflation numbers coming into the fourth quarter of this year were worrisome, in reality, inflationary pressures—whether measured by incoming producer prices or wage pressures—had already peaked and would likely have continued to improve in 1991 and beyond, given the weak growth trends.
To summarize, while recessions are the abrupt corrections of excesses in the economy, soft landings should be characterized by the same correction process except spread over a longer time span. That is exactly what we were experiencing until the Iraqi invasion of Kuwait.
The invasion
The invasion caused consumers and businesses to delay buying decisions and speeded up layoffs and restructurings. While the direct effect of the increase in oil prices was negative, it was not that large a change and by itself would probably not have had much effect on the economy. The increase in uncertainty, however, was enormous, especially as the crisis got into full swing in October and November. Figure 4 shows the effect of uncertainty on consumer purchasing decisions and figure 5 shows the TED spread (the difference between Euro dollar and treasury bill returns), a common measure of uncertainty in the financial markets. As can be seen, the change in uncertainty is dramatic and occurred either in late September or in early October. This was not a slow building process of accumulated unease growing out of the deep problems that the doomsayers dwell upon.
4. Consumer buying uncertainty
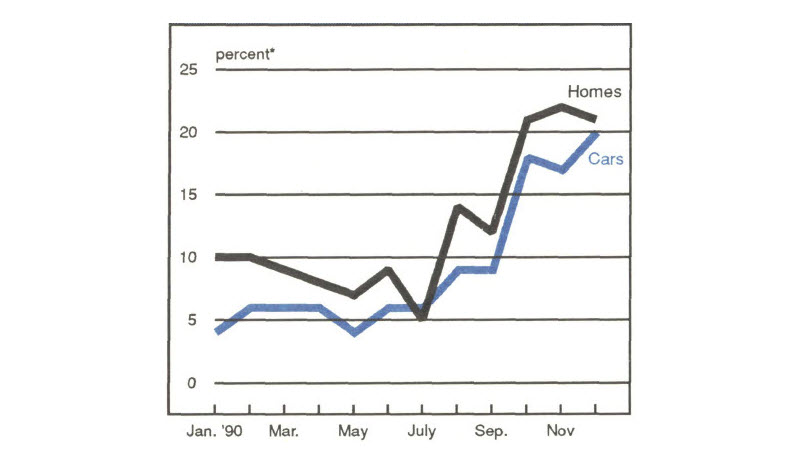
Source: University of Michigan Survey of Consumers.
5. Financial market uncertainty
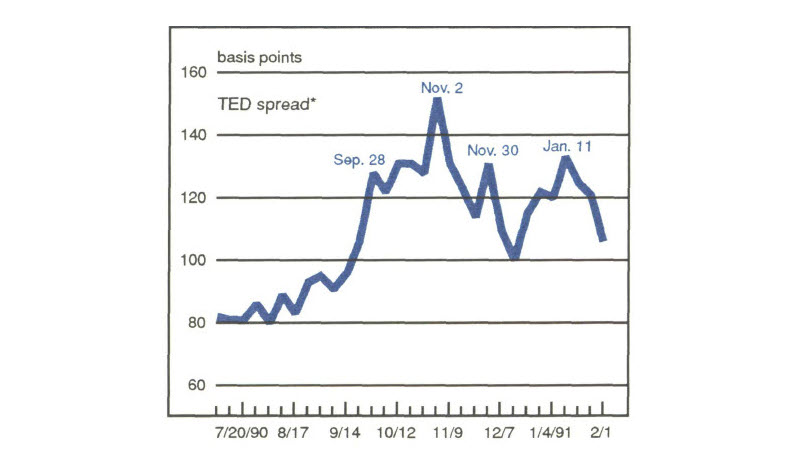
Source: Wall Street Journal.
The problem uncertainty creates for the economy as a whole is that when faced with high levels of uncertainty, individuals and businesses delay purchasing decisions. While delaying a purchase is inexpensive for an individual, it can generate significant disruption in the economy as a whole if everyone does it. Think, for example, of the tremendous traffic jams caused by looking at the accident on the other side of the road.
Uncertainty primarily causes individuals to postpone purchases of durable goods, such as cars, houses, and related goods, until the situation resolves. Thus, despite low inventories in manufacturing, large cutbacks in production instituted during the previous slow growth period, and declining mortgage rates, the uncertainty generated by the Gulf crisis caused a classic recession led by falling consumer demand with the falloff centered in durable goods. If this recession had been foreordained by the weakness in real estate, the restructuring of the service sector, or debt as most of the analysts who were predicting recession argued, the recession would be centered in those sectors instead of durable manufacturing and retailing.
Nevertheless, the weakness in services and real estate played an important role in making consumers hypersensitive to the problems that might arise from the Gulf. Further, the economic weakness resulting from the Iraqi invasion of Kuwait significantly exacerbated the credit quality problems in the financial system, further restricting the already tight flow of credit.
In reality this recession tells us very little about economic behavior beyond the fact that external forces can play a very large role in the economy. It also reminds us that economic models—whether based on financial markets indicators or on economic fundamentals—cannot forecast rapid changes in circumstance, nor should they be expected to.
If the situation in the Gulf resolves soon there is some reason to believe that consumer and business confidence will rebound, and the economy can return to its pre-invasion slow growth path. However, the real economic losses experienced during the disruption may have lingering effects on the financial system and on other more fragile parts of the economy if the situation fails to resolve quickly.
MMI—Midwest Manufacturing Index
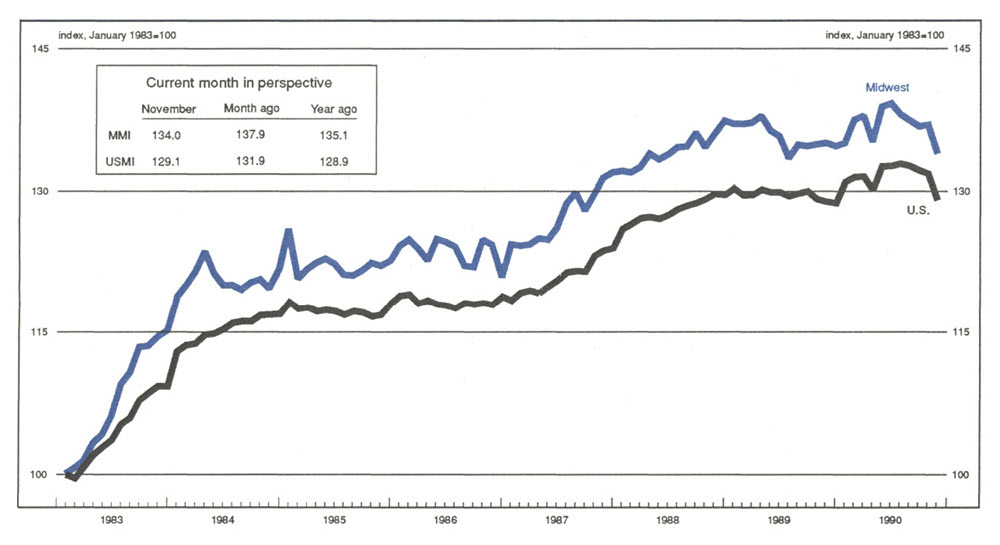
Manufacturing activity in the Midwest dropped sharply in November, following a one-month reprieve from a downward trend that began five months earlier. The 2.2% decline in the MMI was the largest in several years and matched the decline in manufacturing activity nationally. Both the MMI and USMI reflected widespread weakness among industries. However, the transportation sector was by far the hardest hit in the Midwest. Domestic auto production nationwide was cut to a 5.3 million-unit rate (annualized) in November, from a 6.8 million-unit rate a month earlier. A further decline in auto production in December to a 5 million-unit rate foreshadows another month of sizable declines in Midwest manufacturing activity ahead.
Notes
1 The index was developed by James Stock and Mark Watson. See NBER Press Release, November 1, 1990.


