

The following publication has been lightly reedited for spelling, grammar, and style to provide better searchability and an improved reading experience. No substantive changes impacting the data, analysis, or conclusions have been made. A PDF of the originally published version is available here.
In 1996, light vehicle (car and light truck) sales totaled a very respectable 15 million units.1 This matched the highest yearly light vehicle sales rate of the current expansion, which occurred in 1994. In the fourth quarter of 1996, light vehicle sales averaged 14.8 million units and it appeared that the auto sector was set for a slight retrenchment. Instead, what followed in the first three months of this year was the strongest consecutive three-month period for light vehicle sales since the current expansion began six years ago. The surprisingly strong showing for the auto sector was followed by extremely anemic light vehicle sales in April. Sales for the month fell to an annual rate of 14.2 million units, the lowest monthly sales rate in two years.
On May 30, 1997, shortly after these numbers were reported, the Federal Reserve Bank of Chicago held its fourth annual “Auto Outlook Symposium.” Thus, the conference was poised to try to assess whether the sales pace in the early part of this year was an aberration, reflected by April’s sales moderation, or whether 1997 was indeed going to be a very strong year for the auto industry. This Chicago Fed Letter presents the consensus outlook from the symposium and summarizes individual presentations by vehicle producers, suppliers, dealers, and vehicle research organizations.
Consensus outlook for the economy
In the first half of 1997, the economy was a tale of two quarters. First quarter economic performance was stronger than most people anticipated. This was followed by a dramatic slowdown during the second quarter. The symposium participants expect the overall economy, as reflected by real gross domestic product (GDP), to grow by 3.3% for 1997 and then slow to 2.2% next year (see figure 1). They forecast average real GDP growth of nearly 4% for the first half of this year, indicating that a slower pace of growth is expected in the second half of the year. The unemployment rate is expected to decline 0.2 percentage points to 5.2% in 1997 and then rise by 0.1 percentage points next year.
1. Actual 1996 and median forecasts of GDP and related items
| 1996 | 1997 | 1998 | |
|---|---|---|---|
| GDP, chained 1992 dollars (%) | 2.4 | 3.3 | 2.2 |
| Personal consumption expenditures (%) | 2.5 | 3.4 | 2.2 |
| Business fixed investment (%) | 7.4 | 8.5 | 4.8 |
| Residential construction (%) | 5.3 | 1.6 | 0.0 |
| Change in business inventories ($bil.) | 14.0 | 33.6 | 25.6 |
| Net exports of goods and services ($bil.) | -113.6 | -130.3 | -124.3 |
| Government purchases of goods and services (%) | 0.8 | 0.3 | 0.5 |
| Industrial production (%) | 2.8 | 3.8 | 2.4 |
| Car and light truck sales (mil. per calendar year, including imports) | 15.0 | 15.0 | 14.8 |
| Inflation rate (Consumer Price Index, %) | 2.9 | 2.8 | 2.9 |
| Unemployment rate (%) | 5.4 | 5.2 | 5.3 |
Note: Data as of May 30, 1997.
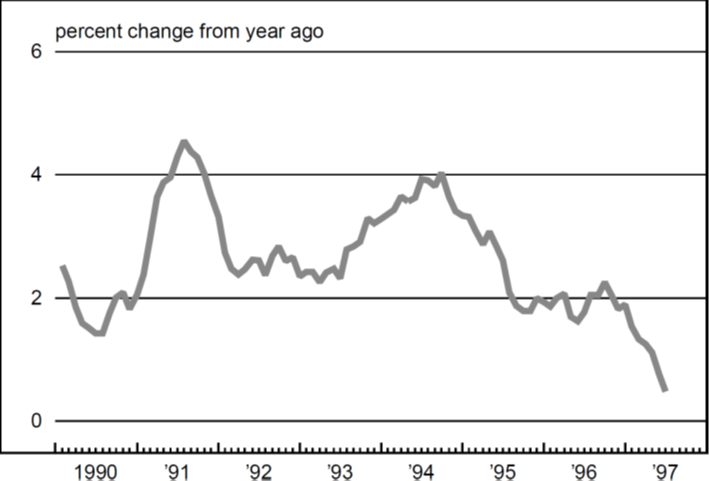
The consensus forecast for light vehicle sales for this year is 15 million units, matching last year’s pace. Given that when these forecasts were made, sales had already averaged 15.1 million units (annualized) for the first four months of the year, the group was expecting sales to slow only slightly for the remaining two-thirds of the year. Next year, vehicle sales are expected to slow to 14.8 million units. Even with this strong performance by the economy, the participants do not see a rise in the rate of inflation. Inflation for the next two years is expected to average just under 3%, in line with last year. What is most striking during this period of strong light vehicle sales is that not only is inflation under control, it is actually declining for new vehicles. In June, new vehicle prices were 0.5% higher than a year ago (see figure 2). This is the lowest rate of price increase for new vehicles since September 1973.
2.Consumer Price Index, new vehicles
World vehicle market
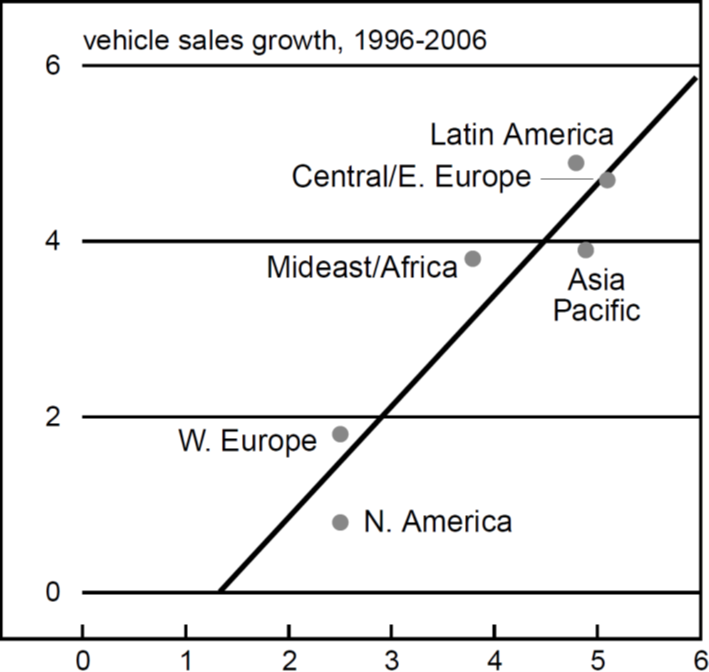
An economist from one of the major auto producers presented the company’s outlook for the auto industry. One important point that the economist made was that while North America and Western Europe will continue to be very important markets given their volume, most of the growth in vehicle sales will occur outside these markets. Growth in vehicle sales is very closely tied to growth in real GDP. In Asia Pacific, Latin America, and Central and Eastern Europe, real GDP is projected to grow at twice the 2.5% average rate forecasted for the next ten years in North America and Western Europe. As a result, the share of real-world GDP will shift from North America and Western Europe to Asia Pacific, with some slight increase in Latin America and Central and Eastern Europe. Vehicle sales growth should reflect this shift (see figure 3).
3. Vehicle sales and real GDP
U.S. vehicle market
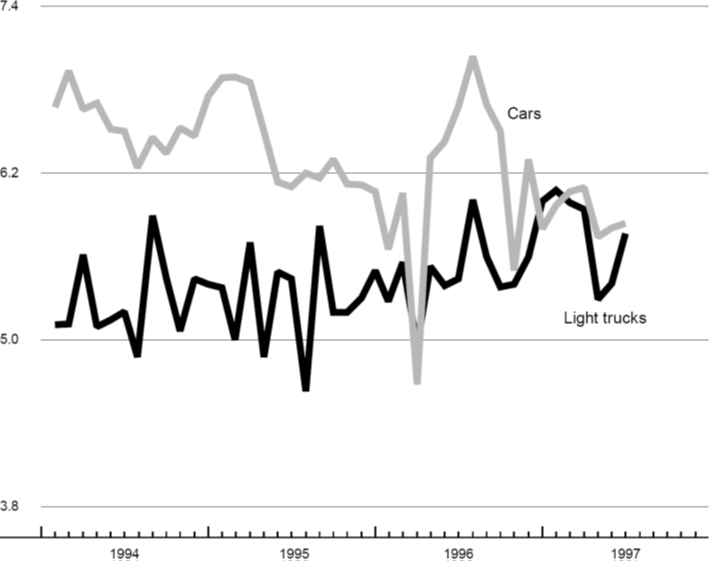
In the U.S. market, while new vehicle unit sales in 1996 were about 5% lower than the level achieved ten years ago, real revenue per vehicle was up 14%. This increase in real revenue per vehicle is due to the fairly dramatic movement from car to truck sales that has taken place over the past ten years. In 1986, truck sales comprised 30.2% of the new vehicle market; last year their share had grown to 44.8%. The average transaction price of trucks is higher than that of cars, driven by the movement toward sport utility vehicles and full-size pickup trucks. The economist indicated that the shift to trucks is likely to continue, with most consumers expressing a preference for more trucks and fewer cars in the future. The forecast for vehicle sales over the next year and a half is for a good sales rate due to solid real GDP growth, moderate inflation, larger vehicle incentives, and strong consumer confidence.
Used vehicle outlook
Ownership rates of 1.9 vehicles per household and 1.07 vehicles per driver have held steady for the past five years. In addition, vehicle quality has increased over time and scrappage rates have been declining. This leaves the consumer with more choices when it comes to transportation.
In this context, an analyst from an auto consulting firm said that the current vehicle market is at saturation level and focused his presentation on the used car market. The age of the oldest vehicles in operation, excluding the oldest 10%, increased from 14 years in 1987 to 18.3 years in 1996. This analyst estimated that while the number of new vehicles sold has been averaging 15 million units per year, the number of used vehicle transactions is more than twice that amount, around 35 million units. However, the battle being waged by the newly created used-car superstores is over “cream-puff” cars, late models with low mileage, and is on a much smaller scale. Subtracting the number of leased vehicles sold to the lessee and those that the dealer sells off the lot (expired lease vehicles or trade-ins) leaves about 784,000 vehicles for the used car superstores, or approximately 5% of the new car market. With vehicle transaction demand growth remaining stagnant and new competitors with different marketing techniques entering the market, consumers will have more choices and the vehicle sales market will have greater competition.
Dealers’ perspective
A representative of the automobile dealers group presented an analysis of how dealers’ costs of operation are doing in this increasingly competitive market and how they vary by the size of dealership. There does not appear to be a relationship between dealership size and overall costs and net profit. This was true for both new and used vehicle sales. The representative pointed out that consumer confidence in May hit a record high for the past 28 years. However, the representative was concerned that if one looked at past peaks, when the index was no longer rising, the economy went into recession. Dealers are maintaining an upbeat outlook on profitability.
Vehicles of the future
A consumer research consultant addressed developments of alternative system vehicles. The consultant pointed out that the development of these products is not consumer-driven but is being prompted by government regulations to lower vehicle emissions. Electric vehicles are the only viable technology currently available that will meet zero-emission standards. Consumers approach an electric vehicle purchase with a certain degree of skepticism. The consultant does not believe that these alternative system vehicles will be able to simultaneously satisfy the government’s zero-emission standards and achieve the performance, in terms of operating range and features of existing combustion engines, demanded by consumers. Consumers continually expect more features and higher quality in their vehicles, and they expect to be able to purchase them at a lower price. Alternative system vehicles will provide fewer features at a higher price. These vehicles are currently being sold at prices comparable to those of luxury cars and high-end sport utility vehicles.
This consultant believes that hybrid vehicles, those that combine an internal combustion engine with an alternative energy device, will be the choice alternative system vehicles over the next ten years. Fuel cell technology will most likely be the long-run winner among the multi-alternative delivery devices. Furthermore, the consultant believes that most alternative system vehicles will be bought for fleet use rather than personal use until at least 2010.
Supplier changes
An analyst from an auto supplier consulting firm indicated that there are several significant trends placing the auto suppliers in a new environment. Some positive trends for auto suppliers are: 1) increasing supply base consolidation, which will lead to greater leverage for auto suppliers; 2) continued globalization, which will widen the customer base available to the suppliers; and 3) manufacturing process innovations that have led to improvements in suppliers’ profit margins.
Several negative trends for auto suppliers are: 1) very large price constraints being exerted by the original equipment manufacturers (OEMs) that have led to profit margin tightening; 2) segment shifts between types of product being manufactured, i.e., cars versus light trucks; and 3) substantial increases in resource requirements in terms of fixed costs, especially for first-tier suppliers. According to the analyst, the risks for auto suppliers include increased product development responsibilities in terms of project management, purchasing coordination, and engineering support; globalization of suppliers in marketing, manufacturing, and currency exchange rate risk; strategic partnering, joint ventures, and technology; and accountability in terms of warranty and product liability being placed on suppliers. The potential rewards include greater leverage from supplier network management; moving from transaction-based purchasing to value-based purchasing; greater capacity utilization; and process simplification and stabilization. The OEMs are still in the driver’s seat when it comes to the automotive suppliers. There has been a reallocation of risk from the OEMs to the suppliers, and the rewards that should be associated with the greater risks have not been passed along to the suppliers.
Geographic considerations
A university professor presented a geographic analysis of vehicle assembly and supplier production facilities in the U.S. The professor found that vehicle assembly plants had returned to the middle of the country. However, the boundaries of where these firms are located cut across the traditional regional classifications, such as the Midwest and the Southeast. Most facilities in the interior of the country are located between Interstate highway 65 (I-65), running south from Chicago, and Interstate highway 75 (I-75), running south from Detroit (see figure 4). These locations help vehicle manufacturers minimize transportation costs.
4. Distribution of assembly plants
| Number of Plants | ||
|---|---|---|
| Region | 1979 | 1996 |
| Midwest | 27 | 31 |
| Southeast | 6 | 13 |
| West | 14 | 9 |
| Northeast | 9 | 5 |
| Total | 56 | 58 |
| I-65/I-75 Corridor | 27 | 29 |
| Non I-65/I-75 Corridor | 29 | 19 |
Source: Presentation by a university professor at the fourth annual “Auto Outlook Symposium,” held May 30, 1997, at the Federal Reserve Bank of Chicago.
Suppliers have also located in the middle of the country, with differentiation taking place between the north and south. High-value-added supplier components requiring highly skilled workers are most likely to be located in the Midwest. The Southeast has a higher percentage of facilities making bulky, low-value-added components. The drift to the Southeast has been due to the influx of foreign-owned assembly plants. These companies seem especially eager to avoid the unionized, high-cost northern labor market. Within the Midwest, new manufacturing facilities are likely to be in southwestern Michigan, northeastern Indiana, and western Ohio. Especially favored are smaller communities in nonmetropolitan counties without a tradition of vehicle production, such as those along Michigan’s Lake Michigan shore.
Conclusion
The auto industry is expected to continue to produce at a level of approximately 15 million units this year and 14.8 million units next year. The industry is still in the midst of great change. World demand is becoming a more important factor, as the U.S. vehicle market reaches its saturation point. The production, distribution, product mix, and even propulsion of vehicles are undergoing tremendous change, and businesses that operate in such an environment need to remain flexible and adaptable to meet the challenges that lie ahead for the vehicle market.
Tracking Midwest manufacturing activity
Manufacturing output indexes (1992=100)
| June | Month ago | Year ago | |
|---|---|---|---|
| CFMMI | 121.1 | 121.2 | 116.8 |
| IP | 121.7 | 121.3 | 116.4 |
Motor vehicle production (millions, seasonally adj. annual rate)
| June | Month ago | Year ago | |
|---|---|---|---|
| Cars | 5.8 | 5.8 | 6.7 |
| Light trucks | 5.8 | 5.4 | 5.4 |
Purchasing managers' surveys: net % reporting production growth
| July | Month ago | Year ago | |
|---|---|---|---|
| MW | 58.7 | 56.0 | 51.1 |
| U.S. | 64.4 | 56.0 | 52.6 |
Motor vehicle production (millions, seasonally adj. annual rate)
The CFMMI decreased 0.1% in June, following a revised 0.4% decline in May. By comparison, the Federal Reserve Board’s industrial production index (IP) for manufacturing increased 0.3% in June. June was the second consecutive month in which every CFMMI sector had slower growth than its national counterpart, suggesting that the economic slowdown in the second quarter had a somewhat greater impact on the Midwest than on the nation as a whole.
The U.S. purchasing managers’ survey for production increased from 56% in June to 64.4% in July. The Midwest purchasing managers’ survey also increased from 56% to 58.7%. Motor vehicle production (seasonally adjusted annual rate) increased from 5.4 million units in May to 5.8 million units in June for light trucks and remained constant at 5.8 million units for cars.
Notes
1 Data are as of May 30, 1997. These data formed the basis for the forecasts delivered at the Federal Reserve Bank of Chicago’s fourth annual “Auto Outlook Symposium.”


