

In this article, we study the creation of small firms, with a focus on the post-March 2020 period (i.e., after the start of the global Covid-19 pandemic).1 We document the increase in new small firms, as well as the contributions of small firms to employment growth, during this period. Our analysis shows that, despite the increase in the number of small businesses, the share of employees working for small firms is considerably lower than in large businesses and is, in fact, declining.
Why do we focus our analysis on new small firms during the pandemic and its aftermath? New small businesses may increase competition, drive innovation, and contribute to overall economic growth: Some research suggests that new small firms can be key to economic recoveries (Fort et al., 2013), encourage entrepreneurial activity (Sedláček and Sterk, 2017), and account for a large share of new job creation (Haltiwanger et al., 2013). Because of this, the rise in new small firms after the onset of the pandemic has some observers (see, e.g., Casselman and Ember, 2024; Simon and Overberg, 2024; and Van Dam, 2025) asking if it heralds a resurgence of economic dynamism that declined during and after the Great Recession (which lasted from December 2007 through June 2009 in the U.S., according to the National Bureau of Economic Research, or the NBER).
After documenting the trends in the number and share of employees in small firms during 2020–24, we explain how they may affect how we count employment in the U.S. Bureau of Labor Statistics’ (BLS) Current Population Survey (CPS) and Current Employment Statistics (CES) survey—which are commonly referred to as the “household survey” and “payroll survey,” respectively. We argue that self-employed workers are unlikely to “lay themselves off” in economic downturns, which may make employment reported in the household survey less affected by downturns than employment reported in the payroll survey, albeit in small magnitudes. Finally, we show that employment growth among small firms is less sensitive to business cycles (i.e., the ups and downs in economic activity, including periods of growth and recession) than it is among large ones by extending the analysis by Moscarini and Postel-Vinay (2012) to the current period.
The main data source for this analysis is the Business Employment Dynamics (BED) database, which is derived from the Quarterly Census of Employment and Wages (QCEW) compiled by the BLS. The data provide quarterly measures of job gains and losses for the U.S. economy, along with breakdowns by firm size. We also use data from the Business Formation Statistics (BFS) from the U.S. Census Bureau to examine new business applications.
New business creation by firm size in the 2020–24 period
As figure 1 shows, there was a sharp rise in new business applications in July 2020; although there was a slight decline in the subsequent month, a second spike and the current levels of this series remain much higher than in the years between the Great Recession and the start of pandemic in the U.S. (i.e., between mid-2009 and early 2020). This pattern is also observed when focusing on “high-propensity applications”—a term used for new business applications that are likely to become firms with employees in the future as determined by the U.S. Census Bureau2—suggesting that in recent years more new businesses that may go on to hire people were formed.3 While increases in applications and, subsequently, in business formations often follow economic downturns, the levels we currently observe are far higher than after the Great Recession.
1. Monthly business applications and high-propensity applications, 2004–25
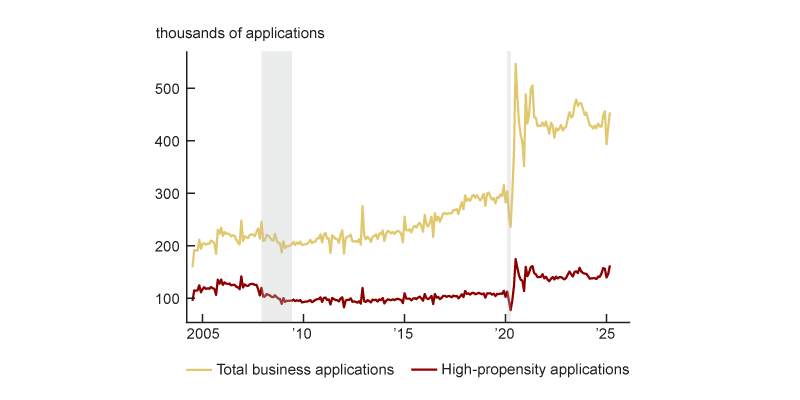
Source: U.S. Census Bureau, Business Formation Statistics, from Haver Analytics.
Since most businesses begin small (Fort et al., 2013), the increase in business formations is likely driven by an increase in newly established small firms. We see this shift in figure 2, which uses BED data. The share of firms with one to four employees rose above 60% after the pandemic began—the highest level in the period examined (2000–24). The share of firms with 50 or more employees remained relatively stable, while the shares of firms with ten to 49 employees and those with five to nine employees decreased slightly. This pattern suggests that firms with fewer than 50 employees have, on average, become somewhat smaller as a share of total employment, which we will show more directly next.
2. Proportion of all firms, by firm size, 2000–24
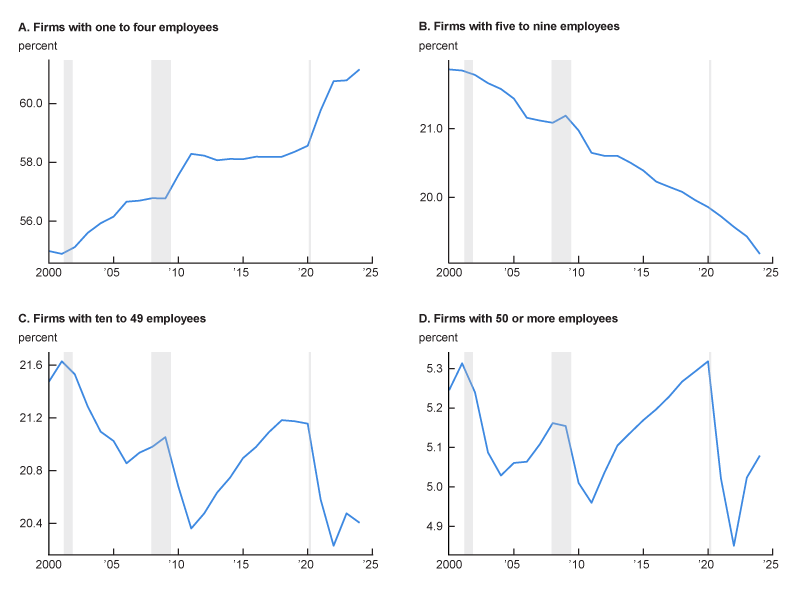
Source: Authors’ calculations based on data from the U.S. Bureau of Labor Statistics, Business Employment Dynamics.
The contribution of small firms to overall employment
It is clear from figures 1 and 2 that there are now more very small firms (i.e., those with one to four employees) than before the pandemic. But are they playing a bigger role in employment? The short answer is no. The longer answer is that although the total number of employees in very small firms has gone up over time, the share of all employees working in these firms has gone down. In this section, we provide a description of these patterns.
Figure 3 shows net employment change by firm size over time, plotting the quarter-to-quarter net employment growth for each size category.4 From the size of the red portion of the bars in figure 3, it is evident that very small firms have experienced higher employment growth over the years 2020–24 than at any point in the past 25 years. To put these numbers in perspective, we calculated the share of net employment change by firm size—i.e., the proportion of total employment growth each firm size category is responsible for—during the recovery from the Great Recession, as well as the recovery from the pandemic recession (which lasted from February through April 2020 in the U.S., per the NBER).5 According to our calculations based on BED data, about 19% of net job gains accrued to firms with fewer than ten employees in the recovery from the pandemic recession, while that number was around 5% during the recovery from the Great Recession.
3. Quarterly net employment change, by firm size, 1992–2024
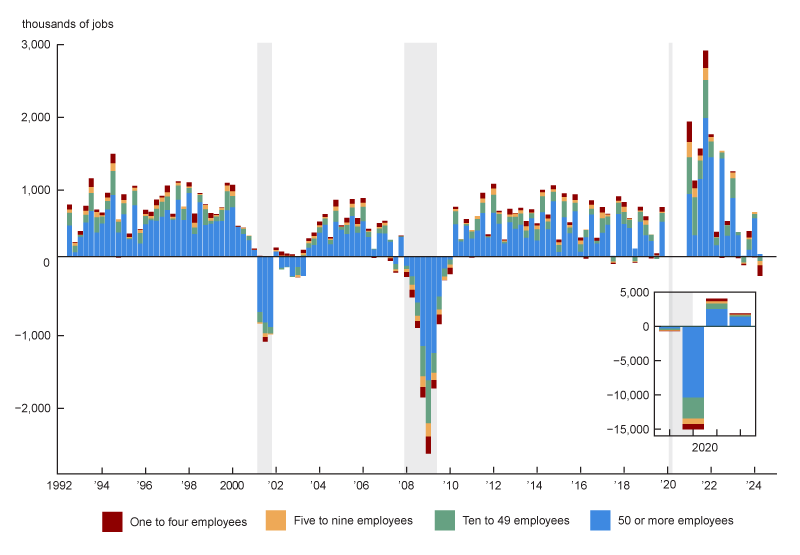
Source: Authors’ calculations based on data from the U.S. Bureau of Labor Statistics, Business Employment Dynamics, from Haver Analytics.
According to figure 3, small firms have added more jobs since the start of the pandemic than before it, but part of that increase is due to there having been more job gains in total. In fact, large firms—represented by the blue bars in this figure—far exceed small firms in their contribution to total employment growth during the pandemic recovery.
Figure 3 suggests that large firms are growing even larger. Figure 4 supports this pattern from the previous figure by showing the share of employment by firm size over the past three decades or so. In general, we observe a consistent downward trend in the overall employment share among firms with fewer than 50 employees, with the exception being during economic downturns and their immediate aftermath (likely on account of layoffs from larger firms and individuals who start new businesses when they are laid off). We observe the opposite for firms with 50 or more employees. The period of the pandemic and its aftermath followed a similar path: Following the initial downward swing, the share of employment in large firms (those with 50 or more employees) returned to roughly its 2019 level and has resumed its upward trajectory (see panel D of figure 4). This shows that over time, large firms are continuing to expand as a share of total employment.
4. Employment share, by firm size, 1993–2024
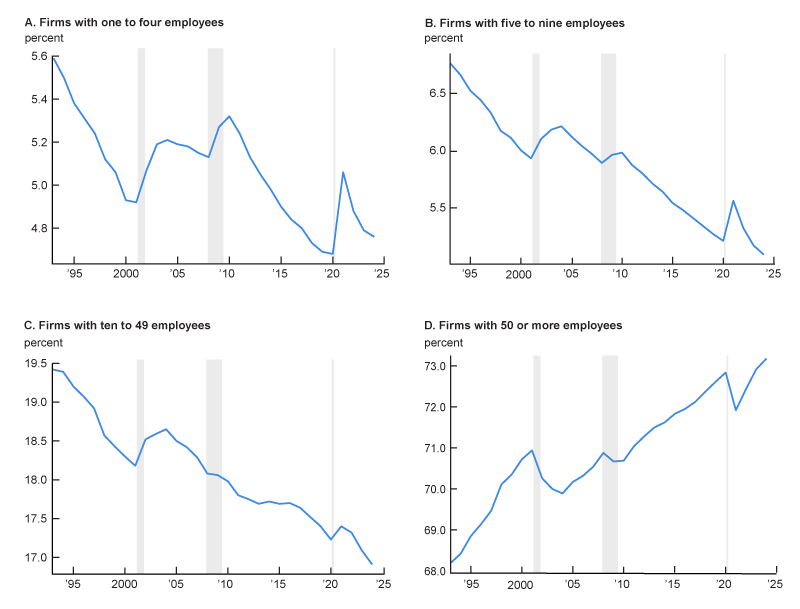
Source: Authors’ calculations based on data from the U.S. Bureau of Labor Statistics, Business Employment Dynamics.
Thus, despite the surge in the number of new small firms in late 2020, the contribution of small firms to overall employment is small; indeed, the contribution of large firms (those with 50 or more employees) is higher than before the start of the pandemic. At the same time, very small firms are also becoming smaller: The average number of employees among firms with one to four employees has fallen to 1.95 in 2024 from 2.15 in 1993, according to our calculations using BED data.
Implications of having more small firms for aggregate measures of unemployment
Although the overall share of employment in small businesses has not changed dramatically, it is possible that the shift toward smaller firms within the category of firms with one to four employees could affect how employment is measured by different surveys such as the CPS and CES, i.e., the household and payroll surveys. An important difference between these two surveys is that unincorporated self-employed individuals are counted as employed in the household survey, but not in the payroll survey.6 People who hold multiple jobs are counted once in the household survey, but multiple times in the payroll survey. When individuals are self-employed as an alternative to unemployment, it is unlikely that these individuals would “lay themselves off,” even if their workload declines considerably.
Decker and Haltiwanger (2023) find that the state-level correlation in the surge in pandemic-era business applications aligns with voluntary quits (and not with layoffs),7 suggesting that new business applications during this era are likely to have been driven by individuals quitting their jobs rather than being laid off. This suggests that people were moving toward new opportunities or trying to gain more flexibility, rather than starting businesses out of desperation. These transitions would look different in the two employment surveys: In the household survey, someone who quits to be unincorporated self-employed would be considered an “E-to-E,” or employment-to-employment, transition, with no implications for measures of total employment. In contrast, the new job would not show up in the payroll survey and would be measured as a decline in employment.
If the rise in very small businesses is associated with either unincorporated self-employment or multiple job holding, we would expect to see changes in their shares of total employment. Panel A of figure 5 shows the share of job holders that are self-employed, and panel B of figure 5 shows the share of job holders who hold multiple jobs. There is a spike in the share of incorporated self-employed workers during the pandemic era, which has moderated back to the pre-pandemic upward trend. These workers should be counted in both payroll survey and household survey employment concepts. There is a post-March 2020 surge in the share of unincorporated self-employed workers, although that seems to have come back down to pre-pandemic levels. Finally, the share of multiple job holders dropped in early 2020, but has trended up since then and is now at levels consistent with the pre-pandemic economy. Thus, the rise in very small businesses (i.e., those with one to four employees) seems unlikely to be materially affecting differences in employment growth measured in both the household and payroll surveys.
5. Self-employed and multiple job holders as share of total employment, 2000–25
A. Self-employed as share of total employment, 2000–25
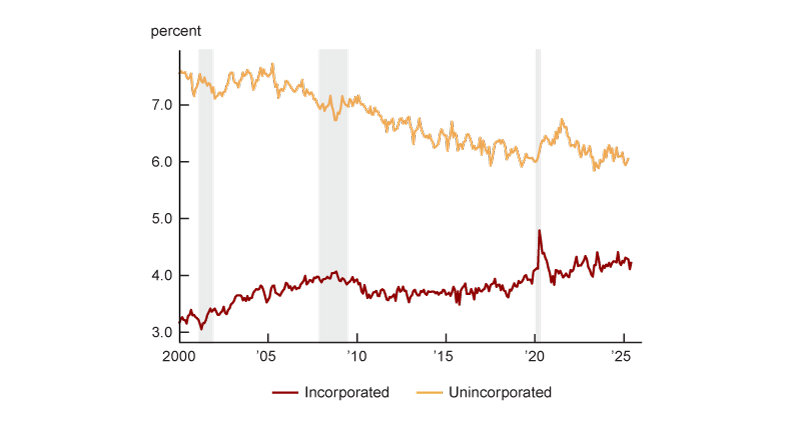
B. Multiple job holders as share of total employment, 2000–25
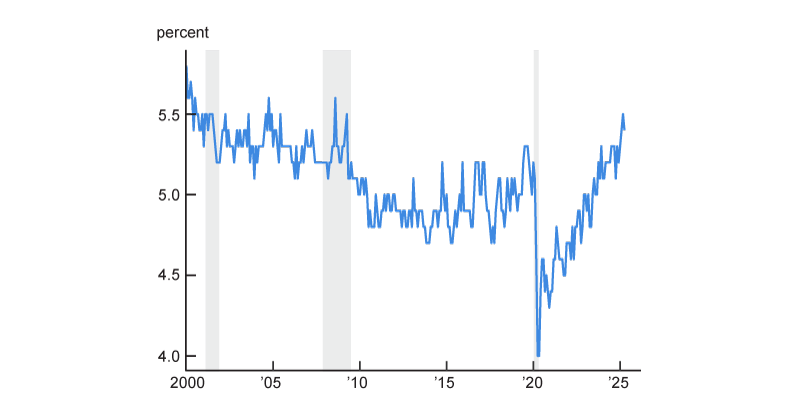
Source: Authors’ calculations based on data from the U.S. Bureau of Labor Statistics, Current Population Survey, from Haver Analytics.
Cyclical sensitivity by firm size
The evidence we have presented in the previous sections shows that there are more small and young firms in the post-March 2020 period, but that the employment share in large firms continues to grow. Employment shares by firm size have the potential to give us some insight into how different shocks might affect employment overall.
To investigate the cyclicality8 of employment among small and large firms in the pandemic era and its aftermath, we extend the analysis of Moscarini and Postel-Vinay (2012) by adding more years of data (through 2024) to the analysis.9 We follow Moscarini and Postel-Vinay (2012) in examining the correlation between the difference in large and small firm employment growth rates and overall unemployment, with both this difference and unemployment being measured as deviations from long-run trends.10 In their work, Moscarini and Postel-Vinay find that the employment growth rate differential between large and small firms increases when unemployment is low and decreases when unemployment is high (relative to their respective long-run trends). In simpler terms, large firms pull ahead of small firms in terms of employment when unemployment is low, but large firms’ advantage shrinks when unemployment is high.
In figure 6, we calculate Moscarini and Postel-Vinay’s (2012) measure of employment growth differentials between large firms (1,000 or more employees) and small firms (one to 49 employees) using our BED data from 1992 onward. Here, the correlation between this differential and overall unemployment in the immediate aftermath of the Great Recession does not seem to fit their pattern. Unemployment was very high then, yet the employment growth of large firms compared to that of small firms rose. However, in the post-March 2020 period, that correlation seems to have returned to the pattern found by Moscarini and Postel-Vinay.
6. Extension of Moscarini and Postel-Vinay (2012) through 2024: Employment growth differential between large and small firms versus unemployment rate
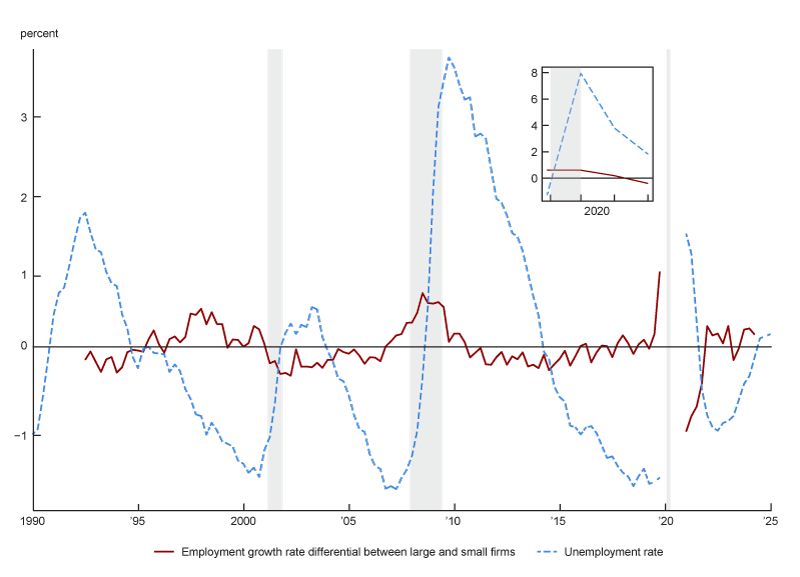
Source: Authors’ calculations based on data from the U.S. Bureau of Labor Statistics, Current Population Survey, from Haver Analytics, and Business Employment Dynamics.
Moscarini and Postel-Vinay (2012) chose these firm size categories because each represented a similar share of employment. Because the post-March 2020 period is marked by a rise in very small firms, we also calculated this figure for the employment growth rate difference between firms with one to nine employees and firms with 1,000 or more employees. We find similar patterns to the ones documented in figure 6 when examining employment growth rate differentials between firms of these sizes.
Conclusion
While the number of small firms (i.e., firms with fewer than 50 employees) has risen, their share of employment has not changed much. The industries in which small firms account for the largest share of employment growth are construction, hospitality, natural resources, retail trade, wholesale trade, professional services, education, and financial services, according to our analysis using BED data. Despite the increase in the number of small firms overall, a large and increasing share of workers work for large firms. The increase in new small businesses could, theoretically, have implications for measures of employment depending on whether individuals report that they are unincorporated self-employed or multiple job holders; however, the current levels of these time series are similar to pre-pandemic levels, so they seem unlikely to be driving outsized differences in employment measured across the household and payroll surveys. The difference in the cyclicality of large and small firms is still a matter of debate—both in terms of whether there is a difference and why. Some research, which we replicate and extend, shows that large firms’ employment growth is more cyclically sensitive than that of small firms. Given our findings show that the post-March 2020 period is continuing the earlier trend of a larger share of workers working for large firms and that employment growth of large firms seems to be more responsive than that of small firms during economic downturns, this combination may amplify the changes in employment with the next shock.
Notes
1 The World Health Organization (WHO) declared the Covid-19 outbreak to be a global pandemic on March 11, 2020.
2 See Bayard et al. (2018) for more information on the Census Bureau methodology.
3 A similar pattern appears in business formations, not just applications, with business formations within eight quarters of the application rising from a level of 30,000 per month pre-pandemic to a (projected) level of approximately 40,000 per month, according to the BFS data. Business formations within eight quarters of the application are the number of business applications that turn into “employer businesses” (i.e., those that hire paid employees) within eight quarters of the initial application. The latest observed data for this series is December 2020; from 2021 onward, formations are projected by the Census Bureau.
4 It is worth mentioning that these Business Employment Dynamics numbers are different from the Current Employment Statistics numbers; in contrast to the BED data, the payroll survey data indicate continuous growth in the number of nonfarm payroll employees since the 2020 recession.
5 Specifically, we compared the employment level in the fourth quarter of 2019 with that in the fourth quarter of 2007 for the Great Recession and the employment level in the second quarter of 2024 with that in the first quarter of 2020 for the pandemic recession, using BED data.
6 The incorporated self-employed individuals are counted as employed in both the household and payroll surveys. They are counted as employed in the payroll survey because they get paid by the corporation (which they own).
7 Decker and Haltiwanger (2023) show that the state-level (log difference) increase in quit rates in the pandemic era is positively correlated with the state-level (log difference) increase in business applications per capita. (The data are seasonally adjusted. The increase is measured for the 2020–23 period versus the 2010–19 period within states.) The state-level correlation between layoffs and business formation is slightly negative.
8 Cyclicality, or cyclical sensitivity, is the degree to which a measure moves in tandem or in the opposite direction when economic times are good or bad; procyclical is defined as something that rises when economic times are good and falls when they are bad, while countercyclical is defined as the opposite.
9 Unfortunately, the debate about the cyclicality of employment in small versus large firms remains unsettled. As Crouzet and Mehrotra (2020, p. 3550, note 2) point out, “estimates of the higher cyclicality of [employment among] small firms range from small firms being approximately twice as responsive to shocks as large firms (Gertler and Gilchrist 1994), to being equally responsive to recessions (Chari, Christiano, and Kehoe 2013; Kudlyak and Sanchez 2017), to being significantly less responsive (Moscarini and Postel-Vinay 2012).” These papers, however, have been estimated in different time periods (and thus identification largely comes from different shocks) and use different definitions of firm size. For example. Crouzet and Mehrotra (2020) use a measure of firm sales to define firm size, while Moscarini and Postel-Vinay (2012) use employment to define firm size.
10 Loosely speaking, Moscarini and Postel-Vinay (2012) first calculate the difference in employment growth rates between small and large firms, after which they detrend the series using a Hodrick–Prescott filter to obtain the long-run relationship and calculate contemporaneous differences from the long-run trend.


