For the better part of the twenty-first century, the Federal Reserve has targeted inflation as measured by the Personal Consumption Expenditures Price Index (PCEPI). Although the U.S. Bureau of Labor Statistics (BLS) releases the Consumer Price Index (CPI) and Producer Price Index (PPI) in the middle of each month, the U.S. Bureau of Economic Analysis (BEA) does not release PCE data until the end of the month—creating a lag of approximately two weeks during which policymakers have some price information but remain in the dark about the Fed’s preferred inflation measure. In this article, we show how to exploit the substantial overlap between the CPI, PPI, and PCEPI to construct "Flash PCE," a high-fidelity nowcast of PCE inflation available at mid-month.
We find that our granular approach, which forecasts PCE inflation at a disaggregated level, produces relatively accurate estimates of headline and core PCE inflation1—ahead of the official release—with a root mean squared error (RMSE) of around 0.6 percentage points at an annual rate (the smaller the RMSE, the better the model’s forecast accuracy). The model performs especially well for aggregates such as housing and core goods (i.e., goods other than food and energy items)—where nearly all underlying price data comes from the BLS. Our analysis also reveals that month-to-month movements in PCE inflation are driven overwhelmingly by changes in prices rather than shifts in expenditure patterns and that missing BLS data represent a volatile and time-varying source of forecast uncertainty.
Two major consumer price indexes: CPI and PCEPI
In the United States, two major indexes track the prices consumers face. The Consumer Price Index, which is published by the U.S. Bureau of Labor Statistics, measures the prices of goods and services purchased out-of-pocket by urban consumers. The Personal Consumption Expenditures Price Index, which is published by the U.S. Bureau of Economic Analysis, measures prices for total household consumption.
The PCEPI tracks expenditures beyond those made directly by American households—e.g., employer-provided health care and spending by nonprofit institutions serving households (NPISHs). This makes the PCEPI the broader measure of the prices American consumers face. Constructing such a comprehensive monthly price index covering all household expenditures in the National Income and Product Accounts of the United States (NIPAs) is a major undertaking and challenge for a statistical agency. The PCEPI stands out as an achievement of the BEA; most other countries do not produce a comparable monthly price index with such breadth.
The Fed has paid particular attention to core inflation as measured by the PCEPI (or core PCE for short)—which excludes the volatile food and energy categories (see note 1)—to better identify underlying inflation trends. Trends in core PCE, as well as its subcomponents—core goods, housing, and core services excluding housing—can be informative about medium-run inflation dynamics: Inflation in the core goods categories can reflect supply disruptions or elevated demand for manufactured items, for instance, while core services inflation is closely linked to labor market conditions.2
One major challenge for monetary policymakers, who rely on the monthly PCE release to inform economic forecasts and policy discussions, is that while the BLS releases CPI and PPI data in the middle of the month, the BEA does not release PCE data until the end of each month. The result is a lag of approximately 15 days during which policymakers have some information on prices and yet remain in the dark regarding the Fed’s preferred measure of inflation.
As it turns out, the mid-month releases of the CPI and PPI contain the great majority of the price data the BEA uses to construct the PCEPI, making it possible to generate accurate mid-month forecasts of PCE inflation. Private forecasters, such as investment banks, routinely report this sort of forecast, but often they do not disclose the models they use; moreover, they seldom generate forecasts for the detailed PCE subcomponents that contain rich information about the various dimensions of price pressures.
In this article, we exploit the overlap between the CPI, PPI, and PCEPI to construct Flash PCE, a high-fidelity, granular PCE nowcast. We call it Flash PCE in the spirit of the Flash HICP3 estimates commonly used in the euro area, which are early estimates of inflation ahead of the final release for a given month. Our aim is to explain how BLS data can be used to produce a nowcast of PCE inflation, demonstrate the historical effectiveness of our nowcast, and discuss what this exercise reveals about the PCEPI more generally.
How PCE inflation is constructed4
The PCEPI aims to measure the monthly change in the cost of all goods and services purchased by U.S. households and the institutions that serve them. It considers the impact on prices of consumers adjusting their spending patterns in response to different price changes across goods and services. Tracking the cost of all household expenditures requires data on two things: first, the prices of the goods and services in the basket, and second, the composition of expenditures. This requires information about spending and price changes for a wide variety of categories covering goods, such as dishes and flatware, and services, such as childcare and legal services.
Source data: Prices
Of the two data inputs used to construct PCEPI, the price data are more readily available for nowcasting purposes. While the BEA pulls price data from a variety of sources, the majority are released by the BLS in the middle of each month—approximately two weeks before the BEA publishes the official PCE release. This means that much of the price information the BEA uses to construct PCE inflation is available mid-month.
For most expenditure categories where the PCEPI covers out-of-pocket spending by households, the price data come directly from the CPI. About half of the services categories and almost all the goods categories belong to this group. The BLS collects prices for these categories primarily through surveys of retail establishments and service providers, tracking what households actually pay at the points of purchase. Because these price quotes are released mid-month as part of the CPI report, the Flash PCE model can incorporate them directly with minimal adjustment.5
Because the CPI covers only out-of-pocket expenditures, the BEA must turn to other sources of price data for PCE categories in which expenditures are made on behalf of households by third parties such as employers, health insurance companies, nonprofits, and the government. For some of these categories, price quotes come from the PPI. Examples of PCE categories with PPI-sourced price data include physician services, hospitals, home health care, and military-issued clothing. Like the CPI, the PPI is released by the BLS in the middle of each month, which means these price data are also available for the Flash PCE forecast.
For the remaining categories where expenditures are not out-of-pocket and suitable CPI or PPI data are unavailable, the BEA relies on its own price indexes or imputes prices using estimates of input costs. In some cases, the BEA constructs its own price indexes from alternative data sources—e.g., food produced and consumed on farms, which is computed using data from the U.S. Department of Agriculture. In other cases, the BEA imputes prices based on input costs, an approach used for certain financial services categories such as life insurance and financial services furnished without payment, for most social services categories, and for all categories of expenditures made by nonprofit institutions serving households. Because these price estimates are constructed by the BEA as part of its own process (and because they are not available from the BLS in the middle of the month), the Flash PCE model must forecast them using historical PCE data. This introduces additional uncertainty into the nowcast, especially for aggregates that rely heavily on these series.
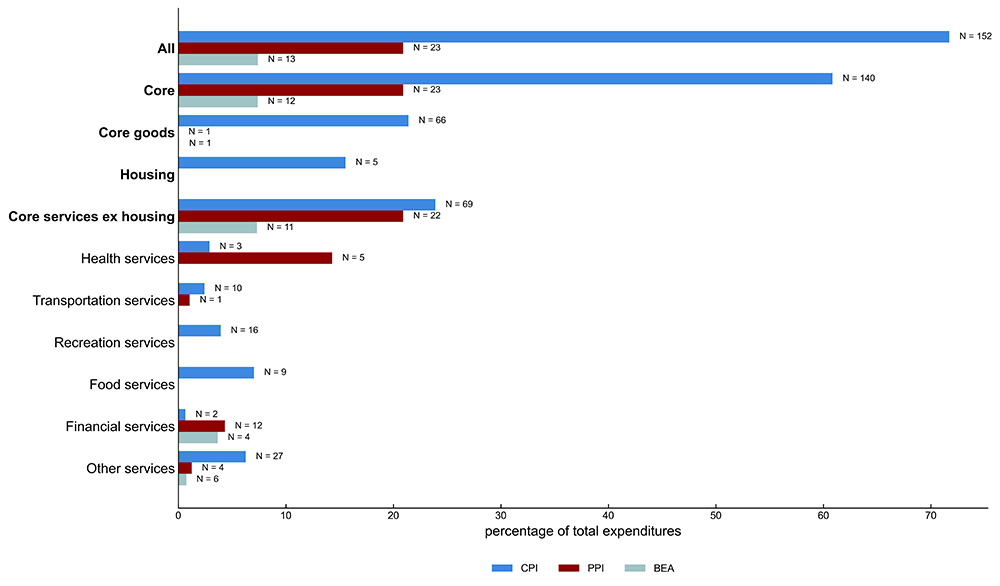
Figure 1 summarizes the price data sources within select aggregates of PCE inflation. The top aggregate in figure 1—representing all series taken together—makes it clear that the majority of PCE series, accounting for over 90% of expenditures, rely on price data from the BLS that are available mid-month.6 The bulk of the PCEPI is based on CPI data, with PPI data playing a smaller but important role for certain categories where expenditures are made on behalf of households. Series for which price data are taken from other sources are concentrated in select subaggregates of core services excluding housing—particularly financial services and other services. This distribution of data sources helps explain the variation in forecast accuracy across different PCE components: Aggregates composed primarily of BLS-sourced series can be nowcasted with high precision, while those relying more heavily on BEA-sourced or -imputed prices face greater forecast uncertainty.
1. Distribution of price data sources across PCE aggregates
Source: Authors’ calculations based on data from the U.S. Bureau of Economic Analysis.
Source data: Expenditures
To build aggregate measures of PCE inflation in a given month, the BEA needs information on nominal spending in addition to price quotes for each individual PCE series. The BEA compiles expenditure data from a variety of sources, including U.S. Census Bureau surveys on durables and retail sales, as well as its own business surveys. Fortunately for PCE nowcasters, expenditure patterns typically do not change dramatically from month to month, which means that the previous month’s expenditure shares serve as reasonable proxies for the current month’s spending shares. See Wilcox (1992) for a discussion of smoothness in consumption data. There are exceptions: When energy or food prices rise rapidly, households must spend more on these items because substitutes are limited, causing notable shifts in expenditure shares. For the Flash PCE nowcast, we rely on lagged expenditure shares, which introduces some potential forecast error when such large relative price changes occur, but generally provides a close approximation of the true expenditure weights.
Computing inflation
Once the BEA has assembled price and expenditure data for all PCE categories, it aggregates them into a measure of overall inflation. The BEA uses the Fisher ideal price index, which is calculated as the geometric mean of two simpler indexes: the Laspeyres index (which uses base-period expenditure weights) and the Paasche index (which uses current-period expenditure weights). In practice, this means the Fisher ideal index accounts for changes in spending patterns over time by incorporating information from both the beginning and end of the measurement period.7
Constructing the Flash PCE nowcast
To generate the Flash PCE nowcast following each month’s CPI and PPI releases, we obtain estimates for prices and expenditures in each disaggregated series, aiming for the most granular level of PCE. We then follow the BEA’s Fisher ideal approach, substituting our estimates of current-month inflation rates and expenditure shares for each category into the PCE calculation formula.8 This allows us to construct inflation aggregates, including headline PCE inflation, core PCE inflation, and subcomponents of core PCE (core goods, housing, and core services excluding housing).
As we described previously, price data for the majority of PCE price series—those covering out-of-pocket expenditures and certain representative spending categories—are sourced directly from the BLS releases for CPI and PPI and are thus available at mid-month. For these series, we use the published BLS data with minimal adjustment; we replicate the BEA’s seasonal adjustment procedures where applicable. For the remaining series, where the BEA constructs its own price indexes or imputes prices from input costs, we forecast current-month inflation using univariate methods applied to historical PCE data.
A complicating factor is that price data from the CPI and PPI are sometimes missing; this happens when BLS response rates are too low to meet publication standards. When this occurs, the BEA uses an inflation estimate based on a judgmental interpretation of the unpublished data provided to them by the BLS. In practice, the inflation rates the BEA inserts when the BLS data are missing tend to be very volatile and, therefore, hard to predict. For the Flash PCE model, we handle series with missing source data by filling missing entries with an expenditure-weighted average of other series within the same BEA aggregate category. For example, when the source data for PCE legal services are missing because of a dearth of data for CPI legal services, our model substitutes in average inflation across other series within legal services’ parent category, namely, professional and other services. Contrary to the other sources of uncertainty in the Flash PCE nowcast, this one varies by month depending on the number of BLS source series with missing data. In some months, outages may affect only one or two series, while in other months they can be more widespread, leading to larger and more variable forecast errors.
With expenditure shares estimated by their current values from the previous month and with inflation rates estimated as described previously, we apply the Fisher ideal formula to aggregate across all disaggregated series and produce our Flash PCE estimates.
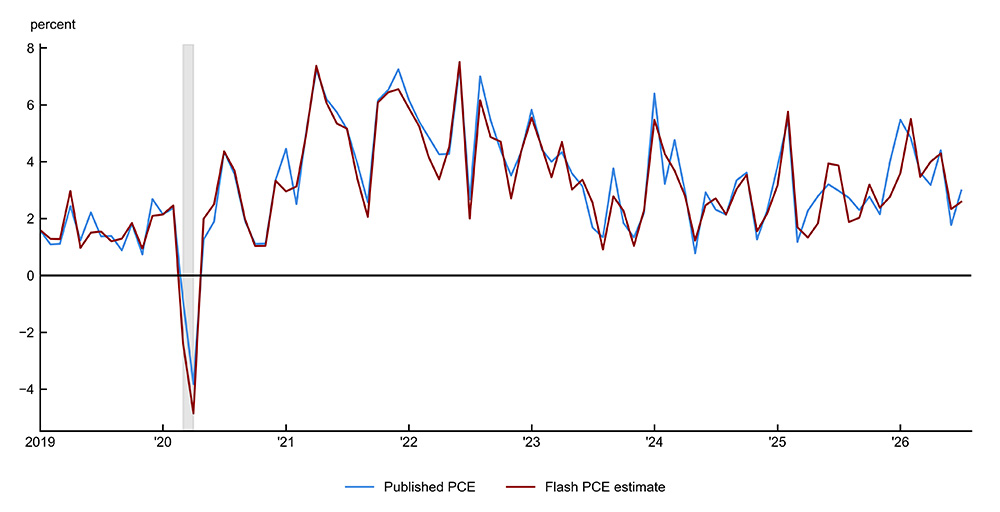
The Flash PCE model performs well in predicting core PCE inflation. Figure 2 compares our Flash PCE estimates with actual core PCE inflation releases since January 2019. Since the start of 2019, our Flash PCE model has captured most of the month-to-month variation in actual core PCE inflation and issued consistently accurate nowcasts across different inflation environments. Over this time period, our model has achieved an R-squared of 0.98, a mean absolute error of 0.45 percentage points at an annual rate, and an RMSE of 0.59 percentage points at an annual rate with respect to month-over-month core PCE inflation—which together indicate a high degree of forecast accuracy.9 Our model’s ability to leverage the PCE price data ahead of time allows for considerable improvement over models that rely on other indicators. For example, Knotek and Zaman (2023) report that the Cleveland Fed’s Inflation Nowcasting model, which takes into account a variety of inflation indicators but not the disaggregated data we use, yields a mid-month PCE nowcast that achieves an RMSE of 0.194 percentage ponts in 12-month core PCE inflation; our Flash PCE model improves upon this mark, achieving an RMSE of just 0.06 percentage points as a predictor of 12-month core PCE inflation since January 2019.
2. Actual PCE inflation and the Flash PCE estimate
Sources: Authors’ calculations based on data from the U.S. Bureau of Economic Analysis and U.S. Bureau of Labor Statistics.
Sources of nowcast errors
Because we use the same index formula as the BEA, forecast errors in Flash PCE come from three main sources: 1) changes in expenditure shares from month to month, as a result of our reliance on lagged shares rather than current values; 2) forecast errors for inflation rates in categories where the BEA uses its own price measures that are not known at the time of the nowcast; and 3) forecast errors for inflation rates in categories where the BEA price does not coincide with the number reported by the BLS or where the BLS did not report a number for that month because of outages or insufficient response rates. The total error we make can be decomposed into parts due to each of these three sources as well as a component due to conversion into an additive index.10 We use this decomposition to understand the relative importance of each error source.
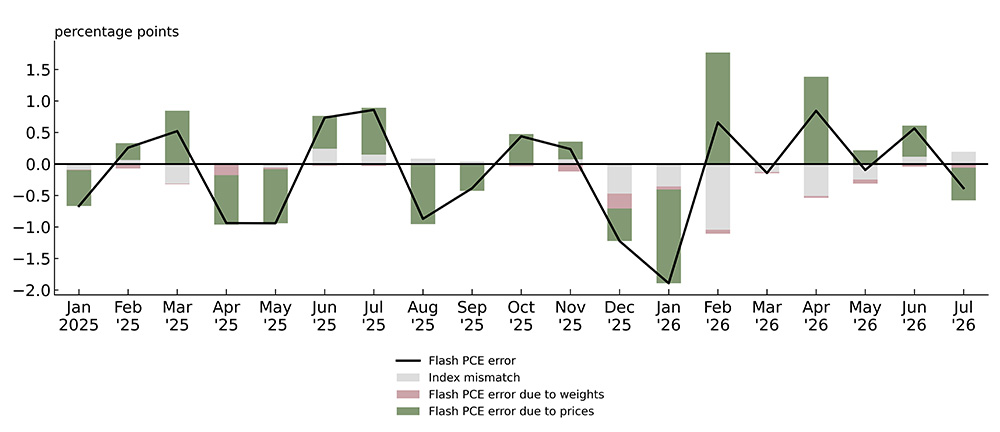
Figure 3 decomposes Flash PCE nowcast errors into contributions from price estimation errors versus expenditure share estimation errors. The results show that nowcast misses come overwhelmingly from errors in our price estimates rather than from our use of lagged expenditure shares. Price estimation errors explain over 99% of the variance in core PCE nowcast error since January 2019, while expenditure share mismatches contribute minimally to such error. This latter finding reflects the fact that expenditure shares tend to move slowly over time—even when relative prices shift, the month-to-month changes in spending patterns are typically small compared with the changes in prices themselves. These results imply that the bulk of mid-month uncertainty about PCE inflation stems from uncertainty about the inflation rates for different goods and services categories rather than from uncertainty about how households allocate their spending across those categories.
3. Core PCE nowcast error decomposed in terms of nonlinear effects, expenditure shares, and inflation rates
Sources: Authors’ calculations based on data from the U.S. Bureau of Economic Analysis and U.S. Bureau of Labor Statistics.
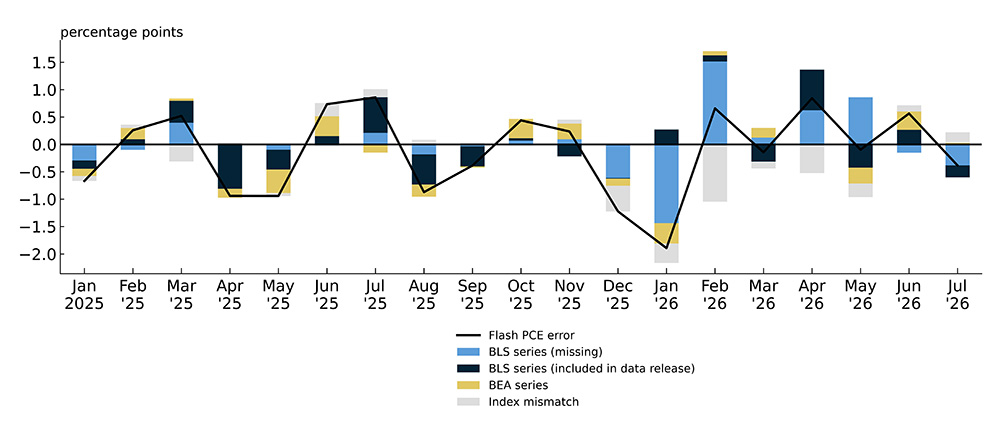
To better understand where this price-related uncertainty originates, we decompose forecast errors by the underlying source of price information and report the results in figure 4. Recall that PCE series fall into three categories: those sourced directly from BLS releases (which are available mid-month and account for roughly 90% of core PCE expenditures), those sourced or imputed by the BEA (which are unavailable mid-month and make up about 9% of expenditures), and BLS series with missing (or discontinued) data (which make up approximately 1% to 2% of expenditures in most months). Several patterns emerge from this decomposition. First, errors from nonmissing BLS-sourced series and errors from BEA-sourced (or -imputed) series, while stable over time, are similar in magnitude despite the vast difference in expenditure coverage, each explaining about 35% of forecast error variance. This underscores that having actual price data available, even for a large share of the basket, does not eliminate forecast error entirely. Second, and more strikingly, BLS series with missing (or discontinued) data represent a volatile and disproportionate source of error. Despite covering typically less than 2% of expenditures, these series can account for the majority of forecast errors in certain months. In January and February of 2026, for instance, widespread BLS data outages led these series to dominate as sources for the overall forecast miss, highlighting how data availability issues introduce time-varying uncertainty into the nowcast.
4. Core PCE nowcast error decomposed by price data source
Sources: Authors’ calculations based on data from the U.S. Bureau of Economic Analysis and U.S. Bureau of Labor Statistics.
We can further underscore the significant role individual categories play in nowcast misses by decomposing error variance at the series level. Figure 5 shows that the top ten series by contribution to error variance account for over 97% of total variance between January 2025 and July 2026, indicating that mid-month PCE uncertainty is highly concentrated in just a few categories. Strikingly, eight of these ten series are ones for which we lack source data at the time of the nowcast—either because the BEA publishes its own price measures independently or because BLS data are missing (or discontinued). This concentration reinforces the key finding from figure 4: While BLS-sourced series with available data cover the vast majority of expenditures, they contribute relatively little to forecast uncertainty because we can observe their values directly. Instead, the bulk of nowcast risk stems from the small share of the basket where we must rely on series that have been forecasted or imputed.
5. Top ten contributing categories to variance in nowcast errors of Flash PCE
| Series | Price data source | Reason for high error | Average share (%) | Contribution to variance (%) |
|---|---|---|---|---|
| Legal services | CPI legal services | Missing BLS data | 0.73 | 21.88 |
| Final consumption expenditures of NPISHs | BEA input cost index | Do not have source data | 2.99 | 17.62 |
| Tax preparation and other related services | CPI tax preparation and other accounting fees | Idiosyncratic BEA–BLS differences | 0.23 | 15.1 |
| Specialty outpatient care facilities and health and allied services | CPI services of other medical professionals | Missing BLS data | 1.20 | 9.77 |
| U.S. travel outside the United States | BEA composite index | Do not have source data | 0.59 | 7.16 |
| Domestic services | CPI domestic services | Missing BLS data | 0.21 | 6.88 |
| Other depository institutions and regulated investment companies | BEA annual composite index | Do not have source data | 1.08 | 5.85 |
| Passenger fares for foreign travel | Weighted average of BLS indexes | Do not have source data | 0.37 | 5.57 |
| All other professional medical services | CPI services of other medical professionals | Missing BLS data | 0.49 | 3.89 |
| Video streaming and rental | CPI subscription and rental of video and video games | Idiosyncratic BEA–BLS differences | 0.24 | 3.39 |
| Total | 8.13 | 97.11 |
Given the outsized contribution of select series to overall forecast error, it is reasonable to expect that the forthcoming annual update to the National Economic Accounts data, set to make improvements to the price data for legal services and two other PCE categories, will constitute a major improvement to the Flash PCE model.11 As it stands, the legal services category is the single biggest contributor to forecast error variance: It’s accounted for over one-fifth of total variance from January 2025 through July 2026. The BEA’s September 2026 update should make our forecast substantially more precise by demystifying the source data for legal services alone.
Conclusion
The Personal Consumption Expenditures Price Index stands as a remarkable achievement by the U.S. Bureau of Economic Analysis—a comprehensive monthly measure of all household consumption expenditures that few other countries produce at similar frequency and breadth.
Our Flash PCE exercise reveals that much of the information the BEA uses to construct this index is available mid-month, approximately two weeks before the official PCE release. Over 90% of PCE expenditures rely on BLS price data published in the CPI and PPI releases. However, the comprehensiveness of the PCEPI requires the BEA to construct certain price indexes and impute others for categories where the BLS does not provide suitable detailed data, particularly in financial services, social services, and nonprofit expenditures.
This data availability pattern means we can produce relatively accurate mid-month estimates of PCE inflation, with a root mean squared error of approximately 0.6 percentage points at an annual rate for core PCE. However, substantial uncertainty remains about inflation in several categories, leading to occasional sizable nowcast misses. Our error decomposition shows these misses stem largely from forecasting difficulties for subcomponents of core services excluding housing—categories where the BEA constructs its own price measures or where BLS data are frequently unavailable. Though small in expenditure shares, these categories’ volatility gives them outsized influence on headline inflation, highlighting both the utility and inherent limitations of mid-month PCE nowcasting.
Notes
1 Core PCE inflation excludes the volatile food and energy categories; further details from the BEA on this measure of inflation are available online.
2 Former Chair Jerome Powell’s November 2022 speech highlights the importance of prices changes in core goods, housing, and core services excluding housing for understanding inflation dynamics (Powell, 2022).
3 HICP stands for Harmonised Index of Consumer Prices; this index was first published by the European Union’s Eurostat in March 1997; more information from Eurostat on the HICP is available online. The Flash HICP was first published by Eurostat in November 2001. The procedure for generating the Flash HICP estimate is explained by Ferreira and Gramaglia (2013).
4 For more details regarding the construction of the PCEPI, see chapter 5 of the NIPA Handbook: Concepts and Methods of the U.S. National Income and Product Accounts.
5 For a small number of CPI-sourced series, the BEA applies its own seasonal adjustment to the raw data, which our model replicates to ensure consistency with BEA methodology.
6 The total number of series reflected by the bar labels in figure 1 does not exactly correspond to the number of PCE series covered by section 2 of the NIPAs. In some cases (e.g., when the source for two or more series is the same), the Flash PCE model groups multiple underlying series together.
7 See the technical appendix for further details on the Fisher ideal price index.
8 See the technical appendix for the precise formulas and mathematical details.
9 For some subaggregates of PCE that source price data almost entirely from the BLS (e.g., housing, health services, transportation services, recreation services, and food services), we can forecast inflation with even stronger precision. Conversely, the Flash PCE model performs relatively poorly when nowcasting aggregates that heavily rely on series sourced by the BEA (e.g., financial services and final consumption expenditures of NPISHs).
10 This decomposition is included in the technical appendix.
11 The BEA announced on June 24, 2026, that its annual update of the National Economic Accounts, set to take effect on September 30, 2026, will include improvements to price data sources for three PCE categories: portfolio management and investment advice services, legal services, and computer software and accessories (Mataloni, 2026).