

Introduction and summary
State and federal highways are currently funded by a combination of motor fuel taxes (MFTs), general fund transfers, fees, tolls, property taxes, and bond revenues. Of these, state fuel and vehicle taxes comprised 26% of revenues used for U.S. highways, and federal fuel and vehicle taxes made up 15% in 2021, according to data from the U.S. Department of Transportation. The MFT share of funding is declining due to increasing overall fuel economy trends, inflation (since many MFTs—including the federal MFT—are assessed in cents per gallon and not indexed), and recent vehicle miles traveled (VMT) trends—especially during the 2020–21 pandemic years, which saw lower passenger and freight travel. Electric vehicles (EVs) have the potential not only to accelerate the fuel efficiency of vehicles in use, but also to lead to a sizable population of individual road users who pay no fuel taxes. A recent study estimated that EVs reduce gas tax revenues by $250 million a year (Davis and Sallee, 2019).
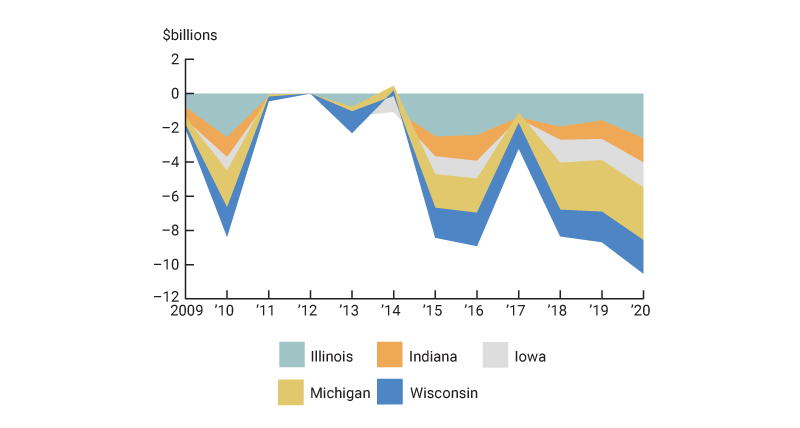
So how will we pay to fix the &*^# roads?1 MFT revenues that were supposed to provide the bulk of funding for road construction, maintenance, and repair have been falling short—causing states to have to dip into the general fund, raise special taxes or fees, or simply forgo critical maintenance and repair projects (which could ultimately result in higher costs as damage compounds). MFT revenue was never expected to be the only source of funding, but states in the Federal Reserve Bank’s Seventh District had an aggregate negative $10.5 billion2 difference between highway user tax revenues and capital outlays in 2020 (figure 1). This deficit illustrates how much states must rely on other sources of road funding and why state legislatures may be looking to increase MFTs, increase fees, and explore tolling or other use tax strategies.
1. Annual difference between highway user tax revenues and total capital outlays, 2009–20
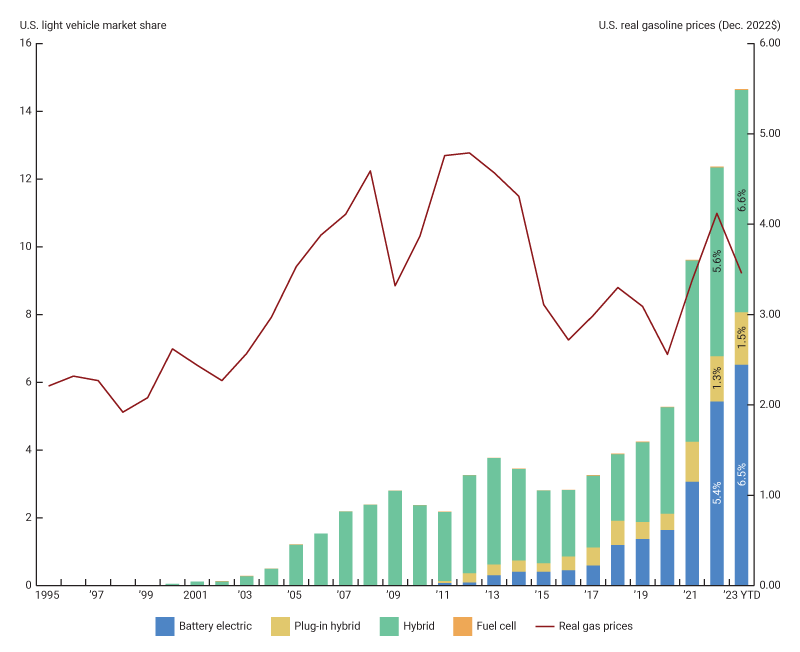
Many state leaders blame the fast-growing share of battery electric vehicles (BEVs), plug-in hybrids (PHEVs), and fuel cell vehicles (FCEVs) on the road for the shortfalls. Indeed, as shown in figure 2, the new vehicle market share of plug-in vehicles (BEVs [blue], PHEVs [yellow], and FCEVs [orange]) more than tripled between 2019 and 2022 to 6.7%, and the market share of vehicles that use no motor fuels at all—BEVs and FCEVs—nearly quadrupled in this period to 5.4% of all new vehicles sold. However, in a country with over 283 million light vehicles in operation, even this rapid growth means that only about 0.5% of all vehicles currently in operation do not use motor fuels. Even if the U.S. reaches its goal of 50% of light vehicle sales being electric by 2030, EVs would only make up about 12% of the vehicles in operation.3 So electric vehicles are not the main cause of declining MFT revenues for most states—yet.4
2. U.S. electrified vehicle share and real gas prices, 1995 to 2023 year to date
While the EV-driven road funding reckoning may be years away, that does not mean that the federal and state governments can ignore the problem of flat and falling MFT revenues. In this article, we explain how roads are currently funded in the Seventh District, recent changes to address funding shortfalls, and strategies that may improve road funding levels in the future.
Fuel economy trends and inflation impacts
Even if electric vehicle adoption was not growing, overall vehicle fuel efficiency is increasing in the United States. The Institute on Taxation and Economic Policy reported that between 1993 and 2020, average fuel economy increased by 26%. While fuel economy standards for new vehicles increased 61% for passenger cars and 30% for light-duty trucks between 2010 and 2020, the average fuel efficiency of the vehicles in operation grew 6.6% in this period (see the blue line in figure 3 for the trend 1993–2020) due to the age and mix of vehicles on the road.
3. Corporate Average Fuel Economy (CAFE) requirements, 1993–2020
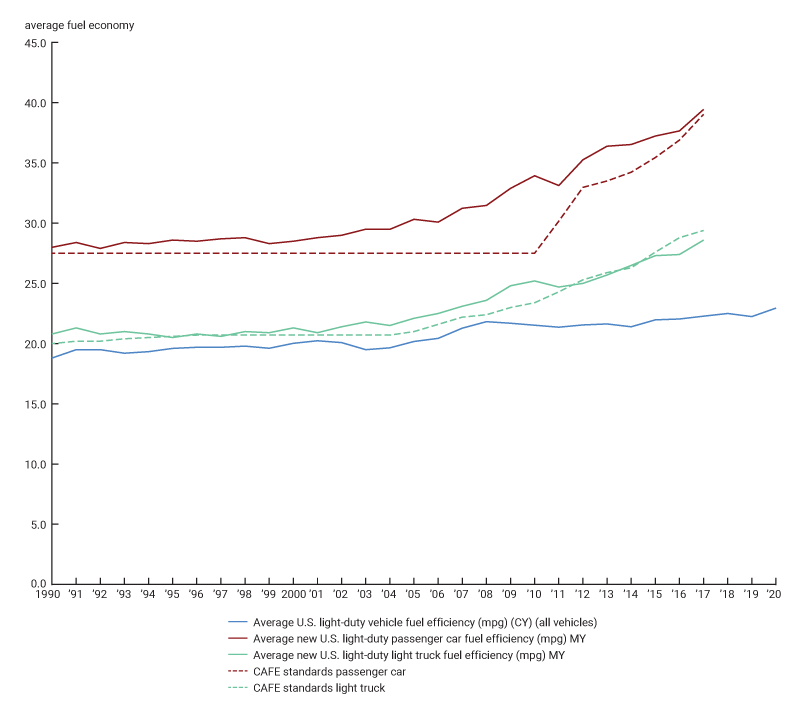
Consider the average passenger car in 1994: This car achieved 20.7 miles per gallon, and its driver paid a total of $0.032 per mile for an average tax revenue of $0.6624 per gallon. In 2018, the average car’s efficiency was 24.4 miles per gallon, but the driver only paid $0.021 per mile in tax, yielding only $0.5124 of revenue per gallon in nominal terms. If the fuel economy of the average passenger car (the blue line in figure 3) were to continue to increase at the 2020 rate of 3.2% annually (to 31.4 miles per gallon) and the MFT continued to be fixed in nominal terms, the driver might only pay $0.014 tax per mile, yielding $0.4327 of tax revenue per gallon by 2030.5
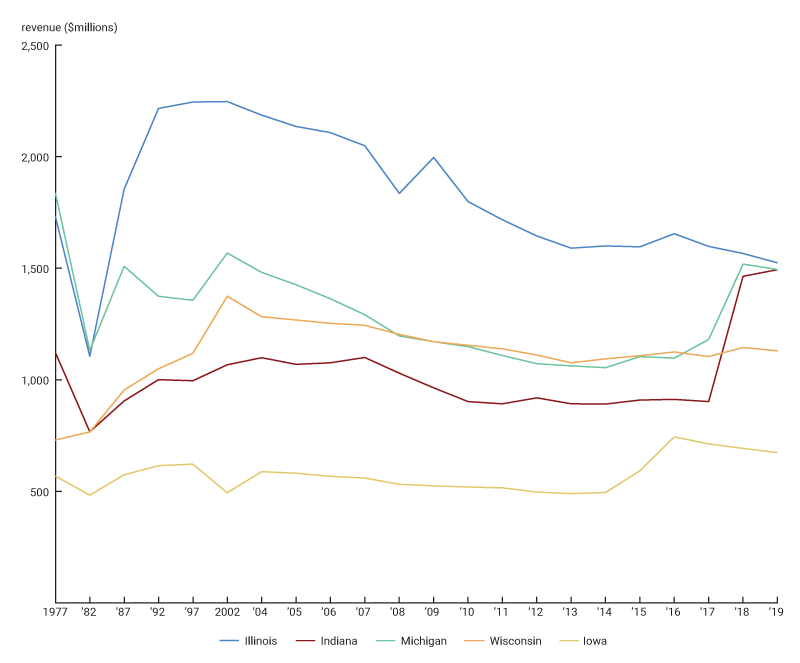
Although real expenditures on American highways have continued to increase since the 1990s, federal and state revenues per VMT have only decreased. A 2020 policy analysis from the Tax Foundation highlights that MFT revenue has not been enough to cover federal transportation expenditures since 2008 (Boesen, 2020). The federal MFT of $0.184 per gallon of gasoline and $0.244 per gallon of diesel has not changed since 1993, and therefore is worth about half its value in current dollars. In the five states that make up the Federal Reserve’s Seventh District, only Indiana saw an overall increase in real MFT revenue between 2018 and 2019. Despite some short-term increases, the overall trends in the Seventh District states’ MFT funding show stagnant or falling real MFT revenues, as shown in figure 4.
4. Seventh District states’ MFT revenue, 1977–2019 (2020 dollars)
Due to increasing fuel economy, greater adoption of electric vehicles, inflation, and other factors, current road funding deficits are projected to continue to grow. This decline, plus the projected increase in highway expenditures, is bad news for the building and maintenance of the country’s highways. It is evident that more exploration into MFT improvements and alternatives is necessary. Since the nation needs to rethink how we fund roads, it makes sense to design a funding strategy that is flexible to technology and increasing fuel efficiency, adjusts with inflation, and addresses equity concerns by deriving revenues proportionately from those who impose wear and tear on the infrastructure.
How do we currently fund road construction, maintenance, and repair?
Consumers around the country are all subject to the federal MFT, which is $0.184 per gallon of gasoline or $0.244 per gallon of diesel fuel as of March 2023.6 These rates have not changed since 1993. The federal MFT is the main source of revenue for the Highway Trust Fund (HTF), which allocates funds to capital projects pertaining to highways and mass transit. Federal excise taxes on gasoline and diesel made up 84% of the fund’s total revenue in 2020. However, the Highway Trust Fund has struggled since 2008 to remain solvent from dedicated highway tax revenue alone. Although the HTF cannot by law incur negative balances, the Congressional Budget Office predicts that the fund’s highway account will have a cumulative shortfall of over $18 billion in fiscal year 2028, growing to over $180 billion by 2033. The fund certainly relies on general revenue transfers. In fact, the situation is likely worse at the federal than at the state level because of the lack of variable-rate MFTs that allow for inflation adjustment. Twenty-three states plus Washington, DC, have legislation that allows for variable-rate MFTs. This means that the MFT rate can vary with inflation, gas prices, highway construction costs, or another metric.
Road funding in the Seventh District
As the Seventh District is home to both Indiana (the “crossroads of America”) and the headquarters of several major automotive companies and global suppliers, it is important for us to understand how the Seventh District states obtain and use funding to maintain the public roads our communities rely on.
Given that MFT revenues are not sufficient to sustainably fund these states’ road infrastructure, state governments are considering other options. Figure 5 shows current MFT rates for each of the five states in the Seventh District.
5. State MFT rates (in cents per gallon) as of January 1, 2023
| State | Gasoline | Diesel | Gasohol |
|---|---|---|---|
| Illinois | 43.4 | 49.9 | 43.4 |
| Indiana | 33.0 | 55.0 | 33.0 |
| Iowa | 30.0 | 32.5 | 30.0 |
| Michigan | 28.6 | 28.6 | 28.6 |
| Wisconsin | 32.9 | 32.9 | 32.9 |
| U.S. average | 29.2 | 31.3 | 28.9 |
Note that these rates may not represent the exact costs that drivers face to use the roads. Several U.S. states peg their MFT rates to inflation, gas prices, or another metric, and some may also charge sales tax on motor fuels. For example, in Illinois the MFT is pegged to inflation; each July it increases by the same amount as the Consumer Price Index for all Urban Consumers (CPI-U, produced by the U.S. Bureau of Labor Statistics). Additionally, some municipalities and county governments can enact their own gas taxes. Indiana’s state MFT is not indexed to inflation, but the sales tax for gas is recalculated monthly based on the average retail price of gas statewide. Michigan began to index its MFT rate to inflation—provided that the inflation rate in the previous year was no greater than 5%—at the beginning of 2022.
MFT usage and recent developments in the Seventh District
Whether or not states have automatic adjustments to their MFTs, it is likely that there have been changes in recent years. Our District’s state legislatures have become more aware of road funding shortfalls and have enacted various initiatives to remedy them.
Illinois
Tax revenue from the Illinois MFT is supposed to be distributed only to the road fund and state construction fund, but the state has historically used MFT revenue to make up budget deficits in other areas.7 The Rebuild Illinois Capital Plan was signed into law in 2019 to address “neglected” state infrastructure, such as roads, railroads, and educational facilities. The plan was intended to make $45 billion worth of such investments over the six years following its passage, of which $33.2 billion would fund transportation-specific investments. When Illinois doubled its gas tax from $0.19 to $0.38 in 2019, the additional $0.19 was expected to add nearly $900 million in annual revenues to funding these investments. This revenue was meant to be put toward the Transportation Renewal Fund, 80% of which was for road and bridge projects and the remaining 20% for rail and mass transit. The actual revenue generated seems to have fallen short of the predicted values due to decreased road travel during the pandemic: A 2021 report by the Illinois Economic Policy Institute (ILEPI) estimates that the state lost $308 million in MFT revenue between April 2020 and February 2021. This loss represented a 13% drop from what the revenue would have been under normal travel conditions and translated to $101 million lost for the state construction fund and $50 million for the road fund. However, this is still more MFT revenue than the state would have earned in the absence of the Rebuild Illinois plan. The report states that the loss was likely driven by a sharp drop in vehicle miles traveled between 2019 and 2020 due to stay-at-home orders, remote work, social distancing, and other pandemic-related factors. It is also possible that decreased freight movement during the early months of the pandemic contributed to forgone MFT revenue. Between February and April 2020, long-haul commercial truck traffic declined 13% and local truck travel declined 17%, compared to a 46% drop in passenger vehicle travel over the same period.
Indiana
Indiana relies on its MFT revenue to fund road and highway maintenance made necessary by the wear and tear caused by both in- and out-of-state users.8 In 2017, the gas tax was raised by $0.10 per gallon; one major goal of this increase was to fund continuing construction on I-69. This effort eventually evolved into the Next Level Roads Initiative to repair, maintain, and restore roads and bridges. Although these projects are funded in part by the state gas tax and toll revenues, in 2019 about two-thirds of the Indiana Department of Transportation’s funding came from federal sources (including the Highway Trust Fund).
Iowa
Iowa’s last major change to its MFT was in 2015, when the state increased its rate by $0.10 because of new state legislation (Senate File 257). More recently, the Iowa Department of Revenue reports that the source used for determining MFT rates changed on July 1, 2020. Prior to that date, gallon totals from the “Iowa Fuel Tax Monthly Report” were used to calculate tax rates; now, the source is the “Iowa Retailers Fuel Gallons Annual Report.” This 2020 change modified fuel categories and resulted in a $0.005 decrease to the state’s gasoline tax, which has not changed since. Funds from Iowa’s MFT on road vehicles are a major contributor to the road use tax fund (RUTF). The RUTF is split into four spending categories: the primary road fund for state roads uses the greatest proportion of the fund, followed by the secondary road fund for county roads, the street construction fund for city roads, and the farm to market fund (also for county roads).
Michigan
All revenue from Michigan’s motor fuel taxes is distributed through the Michigan Transportation Fund (Douglas, 2018). The Michigan Transportation Fund receives most of its funding from gas taxes and vehicle registration fees, which in 2017 contributed $1.4 billion and $1.2 billion, respectively. Another $40 million came from vehicle title fees in that year. The fund then distributes funding to administrative costs, reducing congestion, maintaining rural roads, public transportation, snow removal, and various other state funding and grant programs for local governments. In addition, between 2019 and 2021 some revenues from income taxes were appropriated and distributed to roads agencies.
Wisconsin
In Wisconsin, MFT revenue goes into the Wisconsin Transportation Fund. This fund is considered “unified” because it is used to pay for all modes of transportation and state revenue may not be used for specific programs (e.g., MFT revenues may be used for highway maintenance or public transportation infrastructure). MFT revenue is a major part of the transportation fund: in fiscal year (FY) 2018, it made up 54% of all state revenue sources (which, in turn, are 60% of the entire transportation fund). The next largest state sources for the transportation fund are registration fees, miscellaneous department revenue, and public utility tax revenues. In FY 2018, 47.9% of these state funds were allotted to state highway facilities. More recently, the 2021–23 budget allocated revenue from the transportation fund to various programs, such as State Highway Rehabilitation, Major Highway Development, and others. It also provides funding for local transportation aid programs and the maintenance of Wisconsin Department of Transportation service divisions.
State strategies for recovering fuel tax revenue
With the increased incidence of more fuel-efficient and all-electric vehicles, lawmakers have proposed various revenue streams that could supplement or replace the motor fuels excise tax. These strategies include road user charges (RUCs), also known as mileage-based user fees, registration fees, and excise taxes on charging.
The gas tax alternative that is currently the most widely used in the United States is to impose additional annual registration fees for alternative-fuel vehicles. So far, 31 states have implemented special registration fees for BEVs, PHEVs, and HEVs. All five states in the Seventh District are included among these 31. Michigan was the leader, passing its first BEV and PHEV fees with an amendment to the Michigan Vehicle Code Section 257.801 in 2015. The law established additional annual fees of $135 and $47.50 for BEVs and PHEVs, respectively, and pegged them both to the gas tax; as the gas tax exceeds 19 cents per gallon, each 1 cent increase will yield a $5 increase in the BEV fee and a $2.50 increase in the PHEV fee. These fees may be even higher for vehicles above 8,000 pounds gross vehicle weight. In 2017, Indiana and Wisconsin also implemented BEV and PHEV fees. Indiana Code § 9-18.1-5-12 does not directly peg EV fees to the gas tax, but both the MFT rates and the additional registration fees are indexed to inflation in the same way. Currently, Wisconsin’s fees are static. Finally, Illinois and Iowa passed EV registration fee legislation in 2019. EV fees in Illinois are currently static; similarly, Iowa’s are not indexed to anything, but Iowa Code Section 321.116 provides for annual increases through 2021.9 Figure 6 shows the minimum annual registration fees for each District state.
6. Annual registration fees at time of legislation
| State | Total base registration fees ($) |
BEV– additional ($) |
PHEV or traditional hybrid– additional ($) | Legislation passed | Distribution |
|---|---|---|---|---|---|
| Illinois | 151 | 100 | 2019 | Road Fund, Secretary of State Special Services Fund | |
| Indiana | 36.35 | 150 | 50 | 2017 | Local Road and Bridge Matching Grant Fund |
| Iowa | Based on weight, age, and list price | 65 | 32 | 2019 | Road Use Tax Fund |
| Michigan | Based on MSRP | 135 | 47.5 | 2015 | Michigan Transportation Fund, Scrap Tire Regulation Fund |
| Wisconsin | 85 | 100 | 75 | 2017 | Transportation Fund |
Registration fees represent a lump-sum annual cost, which may prove more of a challenge to pay than MFTs for lower-income households, hence disincentivizing them from buying BEVs, PHEVs, or traditional hybrids. Furthermore, these fees may not be enough to achieve state legislatures’ revenue goals. Therefore, the states in the Seventh District are looking for alternatives.
One fuel tax alternative that has been growing in popularity in Europe and the western United States is a road-user charge or RUC. While none of the states in the Seventh District have implemented RUCs, these charges are nonetheless a topic of discussion in state legislatures. For example, in Wisconsin, a research program for mileage-based fees was proposed and vetoed in 2019. If passed, it could have gone into effect as soon as 2023. The governor stated,
I am vetoing this section because I object to the financing of another study that will show, yet again, that the motor fuel tax is the most effective way to approximate a user fee of roadway use and the most cost-effective way to collect revenue. The Legislature has had more than enough evidence and enough time to study the issue. It is time for the Legislature to stop stalling and act to secure a long-term transportation funding solution.
Several Michigan-based organizations, such as the Anderson Economic Group and the Mackinac Center for Public Policy, have cited RUCs as a potential strategy for recouping lost MFT revenue. The Mackinac Center’s study on RUCs, published in 2022, concluded that it would be beneficial for Michigan to participate in a (perhaps federally funded) RUC pilot. Governor Whitmer has stated that she intends to start discussing the possibility in her second term.
Another MFT alternative is a per-kilowatt hour tax on commercial charging stations. In May 2019, Iowa’s legislature provided for the addition of Section 452A.41 to the Iowa code; this law finalized a $0.026 per kilowatt-hour (kWh) tax on EV charging in the state at any nonresidential charging station, starting on July 1, 2023. Iowa is currently the only state in the District which has passed such a law, although the Illinois Department of Transportation is in the very early stages of considering charging station taxes (Clark, 2022). Iowa’s law comes after several years of research. A 2019 study from the Iowa Economic Development Authority (IEDA) study mentioned per-kWh taxes on charging as a potential remedy for shortfalls in the RUTF. It established that the implementation of such a tax would take extra time since there are no precedents. One consideration is that stations would need to separately meter electricity used by charging stations instead of including it with the rest of the establishment’s use. Furthermore, stations may currently track charging by some other metric, such as time, and would have to adjust track by kWh. Finally, like the traditional MFT, government-owned stations and fleets would be exempt from this excise tax. Government-owned stations used by nongovernment-owned vehicles would have to figure out how to exempt only the fleet vehicles from the tax. The $0.026/kWh tax was calculated in 2019 to make up for lost revenue from the increased adoption of EVs. Four years later, it remains to be seen whether this will suffice.
Currently, there is no general agreement—either in the Seventh District or the country as a whole—on how to tax vehicles to best reflect road usage and maintenance. Ultimately, lawmakers need not choose just one strategy. The solution will likely involve a mix of the above methods.
How might we fund infrastructure construction, maintenance, and repair to reflect vehicle usage?
As we have discussed, current structures for fees and taxes imposed on vehicles to fund infrastructure construction, maintenance, and repair use very different structures that often rely heavily on fuel taxes. These taxes and fees have failed to keep up with technology that has eroded revenues through improved fuel efficiency and the expanding popularity of electric vehicles. Increasing market shares of vehicles that do not use motor fuel provides an opportunity to rethink the relationship between vehicles, road use, and revenue generation to support road infrastructure. In addition, these taxes fail to consider other externalities of driving, such as environmental and health impacts, traffic congestion, and fatalities. Other research has found that a tax encompassing all these factors would be $2.23/gallon in the United States, or more than four and a half times higher than the current average U.S. gas tax of $0.29 (Coady, Parry, and Shang, 2018).
A starting point would be to suggest some principles for how such a revenue system could be structured. In general, there are three guiding principles of taxation: distribution of tax burdens, economic efficiency, and ease of administration. The distribution of tax burdens includes three subprinciples: horizontal equity, ability to pay, and the benefits principle. Horizontal equity says that taxpayers who are in similar socioeconomic positions should take on similar burdens. Similarly, ability to pay means that the tax burden should be in line with taxpayers’ resources. Finally, the benefits principle says that the tax burden should reflect the benefit the taxpayer receives from the resulting government service. The second guiding principle, economic efficiency, implies that the tax will not distort economic behavior unless that is the intended purpose of the tax. Ease of administration, the final principle, requires a clear, understandable tax structure, stable revenues, and cost effectiveness.
In terms of current taxes designed to support roads, there is little consideration of the distribution of burdens. Taxes are based on usage without regard to the ability to pay. These taxes most closely follow a benefits-received principle, whereby the taxes and fees are intended to reflect the benefit a taxpayer receives by using the roads. Additionally, recent research has shown that there are distributional impacts of EVs and lost MFT revenues because these vehicles are expensive and tend to be used by high-income households. Davis and Sallee show that more than two-thirds of their estimated lost tax revenue due to EVs is attributable to households that earn more than $100,000 annually (Davis and Sallee, 2019).
Based on the benefits principle, any tax or fee imposed should reflect individual road usage and potential vehicle characteristics that contribute to the relative wear and tear a specific vehicle puts on the infrastructure. This goal would suggest creating a flexible user fee model. A second possible principle would be either discouraging technologies that produce a negative externality (such as air pollution) or encouraging adoption of a clean technology. By potentially creating fees that internalize the pollution externality of combustion engines, costs beyond road usage could be recognized in the revenue structure. This strategy, of course, would require a precise calculation of what the health impacts are that can be directly related to internal combustion engine (ICE) vehicles. The structure that would likely best achieve this goal would be a road user charge (RUC). Such a charge would be agnostic about the technology used to propel the vehicle and would only focus on actual road usage. Since an RUC would likely be tracked through the vehicle’s registration, specific vehicle characteristics could be captured, and the fee structure could be made flexible. This approach could include charging differing fees based on vehicle weight or emissions characteristics and could provide different rate structures for lower-income drivers. Furthermore, if real-time tracking of the vehicle was available, rates could reflect urban versus rural driving and time of day usage—potentially charging more for rush hour or congestion usage.
However, in the United States, pilot efforts to impose RUCs have not proven popular (Povich, 2021). Oregon (in 2015), Utah (in 2020), and California (in 2021) have enacted pilot programs. Privacy concerns over tracking road usage has been a frequent issue, as well as equity concerns attached to leveling a flat user fee regardless of ability to pay (Zhou, Aeschliman, and Gohlke, 2021). Households with low incomes or in rural or disadvantaged areas (who often must travel greater distances) may find such a structure particularly burdensome. The latter issue could be addressed by creating some sort of income-contingent tax credit to mitigate the impact of the charges. A 2018 study calculated the state-specific RUC (called a VMT [vehicle miles traveled] tax in the research) required to replace 2009 MFT revenues (Wang and Miao, 2018). Figure 7 shows the cents-per-mile estimates from Wang and Miao that would replace the 2009 state and federal gas taxes in Seventh District states and our calculation of the cents per gallon equivalent.
7. Per-mile tax required to equate to 2009 state and federal gas taxes
| State | 2009 state and federal gas tax (cents per gallon) | VMT tax (cents per mile) | VMT tax estimate (cents per gallon) |
|---|---|---|---|
| Illinois | 36.4 | 1.653 | 35.870 |
| Indiana | 39.4 | 1.592 | 34.546 |
| Iowa | 43.4 | 1.654 | 35.892 |
| Michigan | 37.4 | 1.783 | 38.691 |
| Wisconsin | 50.6 | 2.208 | 47.914 |
Privacy concerns, however, are much trickier to address. The most efficient system would measure and report road usage automatically (perhaps with a transponder or mobile application) and assess a fee that would be charged against a designated account. An alternative is to require periodic odometer statements from drivers to address privacy concerns that GPS tracking might create. There are issues with creating an account for charging an RUC. From a tax collection efficiency point of view, having motorists deposit money (or link a credit card) to pay the RUC would be ideal. This approach is often used for paying for toll roads using transponders. However, pre-depositing money into an account would be unpopular and especially burdensome to low- and moderate-income households; linking to credit cards creates additional fees for collection and barriers for drivers who do not have credit cards.
There are also concerns about how funds raised by the RUC might be used. In 2021, the San Diego Association of Governments approved a 4.3 cent per mile tax designed to help fund a $160 billion regional plan that would be used, in part, to expand mass transit options primarily for coastal residents. Inland residents objected to RUC revenues being used in part to support a transit system that would not directly benefit them (Migala and Raftery, 2021). If an RUC is truly a user fee, in theory it should only be used for projects that directly benefit road users. A further objection to the plan was on an equity basis, suggesting the tax would unfairly burden those with no other choice than to travel by car.
Another unresolved issue is how to capture revenue from out-of-state drivers. If a standardized RUC were established on a national basis, road usage could be tracked regardless of state location and the federal government could reimburse states on a prorated usage basis. However, individual state RUCs would fail to capture the costs of out-of-state vehicles on their local roads.
Additionally, some have suggested that EVs may be heavier than comparable vehicles and could cause more infrastructure damage as a result. All light vehicles have a maximum curb weight of 6,000 pounds—including EVs, which is less damaging than heavy-duty vehicles that can weigh 8,500–33,000 pounds or more under full loads. While it is true that EVs weigh more than comparable FCEVs and ICE vehicles, and that overall EVs cause 20–40% additional road wear compared to ICE vehicles, most of that impact is due to buses and heavy trucks. Researchers at the University of Edinburgh found that, “smaller vehicles make a negligible contribution [to road wear]” (Low, Haszeldine, and Harrison, 2023, p. 757).
One possible development on the RUC front was contained in the federal Infrastructure Investment and Jobs Act that was passed in 2021. The act provides $10 million per year from 2022 to 2026 for a national RUC pilot program and $75 million for state and local governments to fund their own pilots. Among the goals of the legislation is to increase public awareness about the need for user-based alternative revenue mechanisms for transportation infrastructure.
Other options
Another tax option is to tax kilowatt hours used at public and home charging stations (Iowa Economic Development Authority, 2019). Different tax levels could be set for the type of charging speed in use with the fastest charging technology having higher rates. The advantage to this is that motorists are already used to paying fuel taxes, so extending a similar structure to electric charging may be more palatable (and efficient to collect). However, unlike fueling an ICE car, most charging takes place at the owner’s home, which would require setting up separate metering for home-based EV chargers and applying a tax on their usage. A kilowatt-hour charge would likely be unpopular and logistically difficult to implement for home charging. In addition, taxing only public chargers would create an equity issue for EV users that do not have any home charging options.
A complicating consideration in an RUC structure is the recognition that road infrastructure provides broad societal benefits beyond the individual user. There is a long literature illustrating the productivity benefits of roads (and particularly maintenance) to general economic growth, which would suggest additional broad-based revenue support beyond an RUC (Aschauer, 1989; Fernald, 1999; Munnell, 1992).
Lessons from abroad—What can Norway teach us?
Norway is the clear international leader in EV adoption. The national goal set by the Norwegian government is for all new cars sold by 2025 to be zero-emissions vehicles (ZEVs). According to data from the International Energy Agency, in 2021, 86% of all new car sales in Norway were BEV or PHEV models.10 Much of the credit for speeding consumer acceptance owes to aggressive public policies, including tax benefits for EV ownership.
Norway’s approach to vehicle taxation is guided by a concept called “the polluter pays,” whereby high-emissions vehicles are charged high taxes. Initially, the tax at the time of purchase for all ICE vehicles was calculated as a combination of weight and the emissions levels of two harmful pollutants—carbon dioxide (CO2) and nitrogen oxides (NOx). Norway’s polluter-pays rate structure was progressive, increasing based on emissions levels. In contrast, EVs were exempt from both the purchase tax and Norway’s value-added tax (VAT). Recently, the exemption has been modified to a 25% VAT exemption for EVs on only the first 500,000 kroner of the purchase price. Starting in 2023, EV owners must pay a portion of the purchase tax based on their vehicle’s weight.
Norway’s EV incentives extend to toll roads. Counties and municipalities cannot charge EVs more than 70% of the price for fossil fuel cars on toll roads. Similarly, the charge on ferries is capped at 50% of that charged for ICE vehicles. Finally, government cars were required to be ZEVs by 2022 and city buses must be ZEVs by 2025.
Norway’s EV incentives have created a revenue hole of 19.2 billion kroner (equivalent to $2.32 billion) that is leading the government to reduce some of the favorable treatment EV owners receive (Meaker, 2021). In 2023, in addition to reinstituting some portion of the purchase tax based on an EV’s weight and charging the 25% VAT on the purchase price of more expensive models, the government is also removing the exemption from the annual road tax for EVs, and EVs will no longer have free municipal parking. Some Norwegian local and regional governments are even limiting the access to bus lanes that was previously granted to EV passenger cars.
Norway’s approach is driven by the need to meet its zero emissions and broader climate change policy goals. As such, the loss of revenue to fund road infrastructure is a secondary consideration.
Conclusion
As we have discussed in this article, the existing funding model for paying for road construction and maintenance was in significant decline even before the advent of electric vehicles. Heavy reliance on motor fuel taxes that failed to reflect improved vehicle mileage as well as inflation have eroded the real value of this tax revenue source over the past several decades. Efforts to bolster road revenues through additional driving-related fees, such as registrations, have helped but often are unevenly applied from state to state.
The increasing popularity of electric vehicles is providing the impetus for policymakers to rethink how road funding should occur. If a guiding principle is that well-maintained roads provide productivity benefits to society and to road users, funding models should attempt to reflect this productivity goal. One potential first step would be to design tax systems where the benefit received by the user of roads is reflected in the taxes paid to support road conditions. This approach would seem reasonably straightforward.
The wildcard is determining whether to use any new revenue structure to reward or punish specific technologies for their societal benefits or costs.
Notes
1 A riff on Michigan Governor Gretchen Whitmer’s habit of using a colorful phrase to reference efforts to improve the state’s roads.
2 Dollar values are nominal unless otherwise specified.
3 Federal Reserve Bank of Chicago staff estimate.
4 Except for Illinois, most of the states in the Chicago Fed’s District have relatively slow EV penetration rates. Illinois ranks eighth among U.S. states for BEV sales 2011–22 with 60,393 vehicles. Michigan ranks 19th (24,004), Wisconsin ranks 27th (15,230), Indiana ranks 28th (14,874), and Iowa ranks 35th (5,371). States with higher BEV sales, such as California (which ranks first, with 902,304 BEVs sold), Florida (second, with 149,421), and Texas (third, with 111,242), will confront the tax shortfalls much sooner if they do not adjust their sources of road funding.
5 Federal Reserve Bank of Chicago staff estimate.
6 See online, Frequently Asked Questions (FAQs) - U.S. Energy Information Administration (EIA). These values include a $0.001 per gallon leaking underground storage tank (LUST) fee.
7 The Transportation for Illinois Coalition estimated that $522 million was diverted from Illinois transportation funds in 2015, or about 20% of the state’s highway user tax revenues that year. In 2016, voters approved the “lockbox” amendment, which ensured that all transportation-related revenue was to be used only for transportation-related purposes. The Illinois Supreme Court upheld the amendment in 2022.
8 However, this also means that much of the federal gas tax collected in Indiana leaves the state. Between 2015 and 2020, only 92.8% on average of Indiana’s funds used for the federal FAST Act (Fixing America’s Surface Transportation Act) returned to the state (see online).
9 See online, Special Fees on Plug-In Hybrid and Electric Vehicles.
10 More information is available online.
References
Aschauer, David Alan, 1989, “Is public expenditure productive?,” Journal of Monetary Economics, Vol. 23, No. 2, March, pp. 177–200. Crossref
Boesen, Ulrik, 2020, “Who will pay for the roads?,” Fiscal Fact, Tax Foundation, No. 725, August, available online.
Clark, John, 2022, “Illinois DOT weighing EV tax to offset gas tax revenue loss,” WCIA.com, September 30, available online.
Coady, David, Ian W. H. Parry, and Baoping Shang, 2018, “Energy price reform: Lessons for policymakers,” Review of Environmental Economics and Policy, Vol. 12, No. 2, Summer, pp. 197–219. Crossref
Davis, Lucas W., and James M. Sallee, 2019, “Should electric vehicle drivers pay a mileage tax?,” National Bureau of Economic Research, working paper, No. 26072, July. Crossref
Douglas, Chris, 2018, “How road funding works in Michigan,” in Roads in Michigan: Quality, Funding and Recommendations, Midland, MI: Mackinac Center for Public Policy, available online.
Fernald, John G., 1999, “Roads to prosperity? Assessing the link between public capital and productivity,” American Economic Review, Vol. 89, No. 3, June, pp. 619–638. Crossref
Iowa Economic Development Authority, Iowa Energy Office, 2019, “Charging forward: Iowa’s opportunities for electric vehicle infrastructure support,” report, Des Moines, IA, February, available online.
Low, John M., R. Stuart Haszeldine, and Gareth P. Harrison, 2023, “The hidden cost of road maintenance due to the increased weight of battery and hydrogen trucks and buses—A perspective,” Clean Technologies and Environmental Policy, Vol. 25, No. 3, April, pp. 757–770. Crossref
Meaker, Morgan, 2021, “Norway is running out of gas-guzzling cars to tax,” Wired, November 18, available online.
Migala, Henri, and Miriam Raftery, 2021, “SANDAG approves mileage tax over objections of unfairness to East County,” East County Magazine, November 4, available online.
Munnell, Alicia H., 1992, “Policy watch: Infrastructure investment and economic growth,” Journal of Economic Perspectives, Vol. 6, No. 4, Fall, pp. 189–198. Crossref
Povich, Elaine S., 2021, “California expands road mileage tax pilot program,” Stateline, September 28, available online.
Wang, Yiwei, and Qing Miao, 2018, “Implication of replacing the federal and state fuel taxes with a national vehicle miles traveled tax,” Transportation Research Record: Journal of the Transportation Research Board, Vol. 2672, No. 4, December, pp. 32–42. Crossref
Zhou, Yan, Spencer Aeschliman, and David Gohlke, 2021, “Household transportation energy affordability by region and socioeconomic factors,” Transportation Research Record: Journal of the Transportation Research Board, Vol. 2675, No. 10, October, pp. 81–95. Crossref


