

The following publication has been lightly reedited for spelling, grammar, and style to provide better searchability and an improved reading experience. No substantive changes impacting the data, analysis, or conclusions have been made. A PDF of the originally published version is available here.
The weakest economic recovery in the post-World War II era showed promising strength in the second half of 1992, raising business and consumer confidence that the recovery will be sustainable and may even begin to follow a recovery pattern in 1993 more similar to past recoveries. More than 30 business economists and analysts from around the Midwest gathered in Chicago on December 9, 1992, for the sixth annual Economic Outlook Symposium, sponsored by the Federal Reserve Bank of Chicago, to discuss the prospects for the American economy in 1993. The consensus view was for a steady improvement in economic activity in 1993. Nevertheless, economic growth was expected to remain below historic rates of recovery. This issue of the Chicago Fed Letter summarizes the consensus of 24 forecasts submitted at the meeting and highlights the related discussion of key industries important to the Midwest economy.
Economywide perspective: edging up to trend growth
The consensus forecast of real gross domestic product (GDP) growth for 1993 is 2.8% (on a year-over-year basis), with only the second half of the year expected to fall within the lower end of the normal range for the mature phase of a recovery. Even among the more optimistic at the meeting, only six forecasters predicted GDP growth of 3% or higher, which is on average little better than trend growth for an economy (GDP has averaged 3.1% annual growth since 1948).
The weakness of the economic recovery—both to date and projected through 1993—perhaps can be understood most easily from the perspective of the normal recovery pattern, based on an average of the four previous recoveries (see figure 1). For example, the first six quarters of an economic recovery typically achieve growth rates in real GDP in a range of approximately 5% to 7%. Following the severe 1981-82 recession, annualized GDP growth rates over the first six quarters of recovery ranged from 4% to 11%. However, the typical sharp snapback of the earliest stage of recovery did not occur in 1992, in part because two key components of the economy—autos and inventories—did not experience their normal rebound. At the same time, neither employment nor income kept pace with their normal recovery patterns.
1. GDP Growth Rates
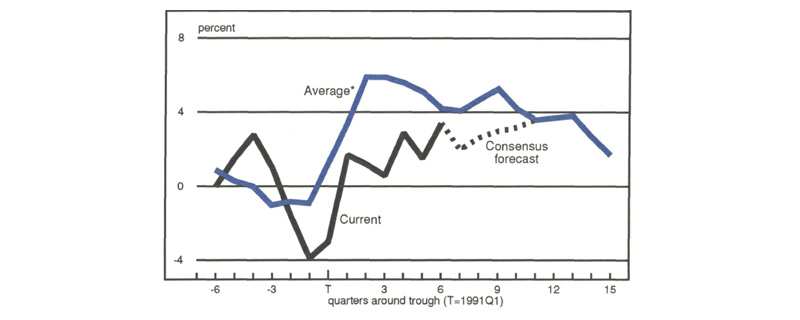
Sources: Bureau of Economic Analysis and Federal Reserve Bank of Chicago.
The expected distribution of economic activity in 1993 also offers some insights into how the recovery will develop. Business fixed investment and residential construction, for example, are expected to boost their growth rates to 6% and 9%, respectively, in 1993 and lead the recovery. Consumption, which represents roughly two-thirds of total GDP, is expected to grow at a pace slightly below 3%, after rising only 2% in 1992. An improvement in consumer spending got underway in the second half of 1992, with many retailers experiencing one of their best Christmas selling seasons in years. The group generally seemed to feel that any new federal spending initiatives would have little impact in 1993 because of normal lags in implementing new programs. Consequently, government spending is expected to be flat, making it again a drag on economic growth. Finally, exports may become one of the few strong sectors in 1992 to reverse course in 1993, with growth hindered by an expected rising dollar and a slowing global economy.
Industry perspective: pent-up demand drives growth
Despite the weakness in export growth and limited inventory building, the distribution of economic growth could still benefit manufacturers. The consensus forecast for industrial production showed a 3% gain in 1993, which would be more than twice the growth experienced in 1992 but still subpar by historical standards. In order to better understand the sources of the weak recovery, a closer look at key manufacturing industries can be useful.
Autos
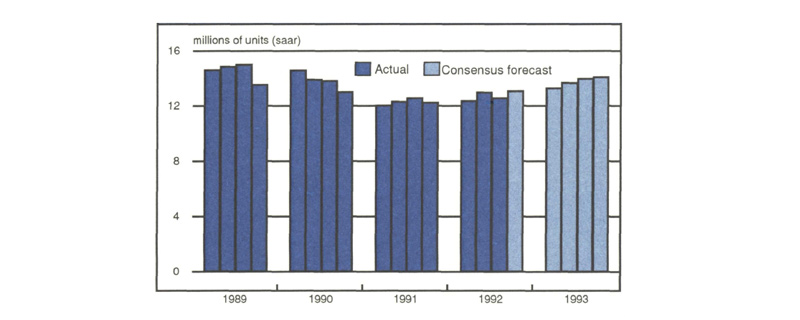
Car and light truck sales, a major factor in business cycles, have been struggling throughout this recovery but are expected to make steady improvements over 1993 (see figure 2). The consensus forecast is for 14 million in car and light truck unit sales in 1993, compared with 12.8 million units in 1992, led mainly by minivans and sports/utility vans. Based on favorable underlying factors, such as disposable income and installment debt trends, an industry economist noted that there was a strengthening in consumers’ “ability to buy” during 1992, but consumers’ “willingness to buy,” determined by such things as consumer attitudes and unemployment insurance claims, remained relatively weak until late in the year. Still, the expected gains in auto sales were driven not so much by the overall improvement in the economy or consumers’ willingness to buy (although consumer confidence has been rising), but by the release of pent-up demand that has accumulated in recent years.
2. Quarterly car and light truck sales
Housing
A second important source of growth expected to improve in 1993 is in residential construction. After one of the worst housing markets in years, housing starts made a comeback in 1992 and are expected to rise 12% in 1993 (see figure 3). Lower mortgage rates in 1992 were a significant factor in the rebound in housing activity, which was evident not only in starts but also in new and existing housing sales. Besides refinancing, many took advantage of lower mortgage rates to buy a new home (a decision that may have been postponed as much as a year ago). Remodeling expenditures, driven by decreased mobility among baby boomers with children reaching school age, is expected to increase 6% to 7% in 1993. With the forecasters anticipating little change in long-term rates, favorable mortgage rates are expected to continue to support housing activity in 1993. However, virtually all of the growth is expected to come from single-family units.
3. Quarterly housing starts

Appliances
Housing activity is also important as a source of demand for household appliances. While much of the appliance market is for replacements, sales growth is derived from improvements in housing activity. Increases in both existing housing sales (a leading indicator of appliance sales) and home remodeling are expected to provide a boost to appliance sales in 1993. An industry analyst forecasted a 4% to 5% increase in household appliances. As in the case of autos, the analyst saw indications of pent-up demand for appliances that consumers are now beginning to address.
Electronics
Computers and other electronics equipment, which can be classified as either consumer or investment goods, began to rebound in 1992, with consumer electronics sales posting 8% growth. Computers, led by personal and laptop computers, were among the fastest growing household appliances, along with compact disk players, large screen TVs, and fax machines. Telecommunications equipment, like pagers and car phones, are also increasing their consumer market penetration. With key markets for electronics components, ranging from autos to computers, expected to improve in 1993 and orders for electronic components already showing strength, an industry economist projected 15% to 20% growth in semiconductors and electronic components orders in 1993.
Machine Tools
Traditional capital goods markets, particularly machine tools, held up remarkably well during the last recession and the early phase of this recovery and are expected to continue to do well in 1993. Indeed, the most recent Commerce Department Survey of Plant and Equipment Spending showed a healthy increase in real investment spending planned for 1993—up 7.6%, compared with 5.4% in 1992. An industry analyst expected machine tool orders to rise by 12% in 1993, with the bulk of the increase going to domestic machine tool producers. Investment in machine tools and other productivity-enhancing equipment is being driven by producers’ long-term need for cost reduction and quality improvement, regardless of the current strength of demand for their products. This drive to reduce cost and increase competitiveness globally should continue to sustain equipment spending throughout the 1990s.
Trucks
Class 8 heavy duty trucks, which haul over 90% of all freight shipped by truck, experienced a strong resurgence in 1992 (orders were up 13%) and are expected to continue to surge in 1993. After a remarkable 20% rise in sales in 1992, truck sales are expected to reach 135,000 units in 1993—a 14% gain but still below the 160,000 unit peak in 1989. Increases in industrial production, requiring increased hauling, and greater reliance on just-in-time deliveries have contributed to the demand for net additions to freight haulers’ stock fleet of trucks. Medium-sized trucks (classes 3-7) have fared less well than heavy duty trucks, perhaps because small companies are still having problems getting bank financing but are still expected to post modest increases in orders in 1993.
Basic materials
With industrial activity picking up in 1993, demand for basic materials, such as steel and cement, is also expected to show substantial improvement in 1993. Steel shipments are expected to increase by 5% to a level of 86 million tons. Two key markets, autos and steel service centers, are both currently doing well and are low in inventory. Indeed, demand from auto producers was reported to be sufficiently high to keep one high performance steel producer at full capacity in the first quarter of 1993. While neither steel nor cement are expecting a boost from commercial construction because of continuing high vacancy rates, cement demand will continue to benefit from public projects, particularly highway construction. An industry economist expects cement shipments to increase 5% to 6% in 1993 and reach a record level by 1994.
Corporate perspective: restructuring constrains trend growth
While a movement up toward trend growth rates among many industries contributes to short-term growth in the outlook, changing management polices among large corporations may be lowering trend growth in this recovery. Longer-term restructuring of corporate policies is perhaps most evident in hiring, inventory controls, and financial management. While corporations typically reevaluate these policies during recessions to lay the basis for stronger long-term growth, many seem to have begun the process well before the last recession began and participants expected some aspects of this process to continue into the recovery.
Corporate white-collar layoffs have been occurring since the recovery began early in 1991, with Fortune 500 firms like GM, Sears, and IBM making front page news. Evidence of the widespread impact of these layoffs is reflected in the weak employment growth since the overall recovery began. Many corporations are making these cutbacks in order to reduce operating costs in response to global competitive pressures and rising health care costs. The fact that industrial production has picked up in 1992 and participants expect it to continue to improve is indicative of the drive among manufacturers to achieve output growth with the same or fewer workers. But without employment growth, income growth may not be sufficient to sustain consumer spending growth and with it the recovery.
The effort to reduce costs and improve their cash liquidity has also led many large corporations to shift to just-in-time inventory practices. This shift is a key factor in explaining the lack of wide inventory swings that are typical around recession troughs and the absence of a strong snapback in the early stage of the current recovery. Indeed, inventories have been under such tight control that the ratio of inventories to sales has remained at record low levels during the recovery. Inventory investment has increased, but only enough to meet current production demand and not to anticipate future sales. Most participants at the meeting expected inventories to remain under tight control with many firms still trying to further reduce their inventory stocks. If the process of shifting to just-in-time practices continues, inventory investment could remain a drag on the recovery, relative to its role in the past.
Within the nonfinancial corporate sector, muted borrowing demand may also be hampering willingness to spend and, as a result, slowing the pace of the recovery. In the late 1980s and early 1990s, concern arose about the increase in corporate debt, and some highly leveraged firms did experience financial stress during the recession. A financial economist noted, however, that corporate liquidity has been on the mend over the last year and corporations have responded to lower interest rates and strong equity markets by restructuring their balance sheets, laying the groundwork for improvement in corporate spending consistent with the consensus forecast. However, if the perception persists that corporate debt is still higher than desired—by the firm or by rating agencies—corporations may be inclined to delay capital spending projects until they are more comfortable with their financial positions. While the consensus outlook for investment spending is encouraging, it remains to be seen how aggressive corporations will be in expanding investment, particularly if new debt financing is required.
Summing up: sustainability versus restructuring
The consensus outlook for 1993 represents a solid improvement over 1992, if somewhat modest by historical standards. The expected steady improvement over the course of the year should be taken as encouraging but may also be the most vulnerable aspect of the outlook. Steady gains in economic activity are dependent on income and spending growth that themselves are ultimately dependent on employment growth. To date, employment growth has been the most disappointing part of the recovery. The need to replace equipment and satisfy consumers’ pent-up demand may be able to generate much of the growth expected in 1993, but sustained growth will require new sources of consumer income and corporate earnings. In the long run, corporate restructuring should make firms more competitive and their growth may lead to a resumption of their employment growth. But until that stage is reached, employment growth could continue to be sluggish and the recovery vulnerable to setbacks.
Tracking Midwest manufacturing activity
Manufacturing output index (1987=100)
| November | Month ago | Year ago | |
|---|---|---|---|
| MMI | 112.5 | 111.1 | 109.4 |
| IP | 110.8 | 110.3 | 108.6 |
Motor vehicle production (millions, saar)
| December | Month ago | Year ago | |
|---|---|---|---|
| Autos | 6.1 | 5.6 | 5.6 |
| Light trucks | 4.8 | 4.1 | 3.5 |
Purchasing manager’s association: production index
| December | Month ago | Year ago | |
|---|---|---|---|
| MW | 66.2 | 63.9 | 46.6 |
| U.S. | 59.4 | 60.1 | 50.6 |
Manufacturing output index, 1987=100
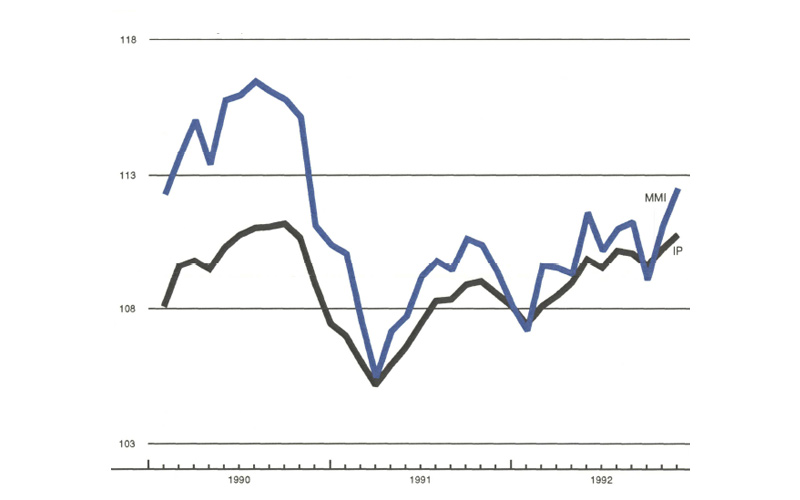
Sources: The Midwest Manufacturing Index (MMI) is a composite index of 17 industries based on month hours worked and kilowatt hours. IP represents the FRBB industrial production index for the U.S. manufacturing sector. Autos and light trucks are measured in annualized physical units, using seasonal adjustments developed by the Federal Reserve Board. The PMA index for the U.S. is the production components of the NPMA survey and for the Midwest is a weighted average of the production components of the Chicago, Detroit, and Milwaukee PMA survey, with assistance from Bishop Associates and Comerica.
Midwest manufacturing activity posted a solid 1% gain in November. The Midwest gain was twice the rate of the Board’s index of manufacturing production for the nation, marking the second consecutive month that the Midwest has doubled the pace of manufacturing activity nationwide. The Board’s index for December rose another 0.5%, raising the likelihood of another solid gain for the Midwest.
Auto production was significant in the recent strong performance in regional and national manufacturing. Domestic auto producers revised their production schedules for the first quarter of 1993 upward to a 23% increase over the weak production of a year ago. For cars, that could translate into a 6.5 million unit build pace (saar), roughly half a million more than for the second half of 1992.


